

Common Chart Patterns Explained with PDF Guides
📊 Learn to identify key chart patterns for smarter trading decisions. Includes reliable formations and handy PDF guides to boost your market strategy locally.
Edited By
Oliver Bennett
Chart patterns provide a solid foundation for reading price movements and spotting potential opportunities in financial markets. For South African traders and investors, grasping these patterns sharpens decision-making, especially amid local challenges like loadshedding or volatile rand fluctuations.
Chart patterns appear visibly on price charts and reflect the battle between buyers and sellers. Recognising these formations helps predict whether a trend is likely to continue or reverse. This guide draws on insights from well-regarded trading books such as Thomas Bulkowski's Encyclopedia of Chart Patterns and John J. Murphy's Technical Analysis of the Financial Markets.

Patterns fall broadly into two categories: continuation and reversal. Continuation patterns suggest the current trend will persist, while reversal patterns hint at change. Examples include triangles, flags, and pennants for continuation; head and shoulders or double tops/bottoms for reversals.
To apply these patterns effectively, one should combine them with volume analysis and other indicators rather than relying on them alone. For instance, a bullish flag confirmed by rising volume can strengthen confidence in an upward move. In practice, patterns like the double bottom have predicted price bounces on JSE shares such as Sasol or Naspers.
Understanding chart patterns is about reading market psychology—each shape tells a story of supply, demand, and trader sentiment.
By integrating chart pattern knowledge into strategies, traders can better time entries and exits, manage risk, and spot shifts early. Whether you favour shares, forex, or commodities, this skill adds clarity to market noise.
In South Africa's complex financial landscape, a practical grasp of chart patterns can be a valuable edge for all market participants, from casual investors to professional analysts.
Chart patterns provide traders and investors with a visual way to understand price movements over time. Seeing how prices form specific shapes on a chart can give clues about what buyers and sellers are thinking. For example, a clear head and shoulders pattern often flags an impending trend reversal, which can help you spot when the market sentiment is shifting from bullish to bearish or vice versa.
Chart patterns are distinct formations created by price action on charts—lines connecting highs and lows over different time frames. These shapes aren’t random; they represent the tug of war between buyers and sellers. Whether it’s triangles, flags, or double tops, each pattern has a characteristic shape signalling potential future moves.
Recognising these patterns is practical because they offer a framework to anticipate price action, making your trading decision less of a guess. For instance, spotting a descending triangle could hint at a possible breakdown, prompting you to prepare for a sell-off.
Patterns don’t just show price—they reflect market mood. Investors’ feelings like optimism, fear, or hesitation get baked into price moves. A rising wedge, for example, may indicate weakening momentum despite rising prices, signalling traders might soon take profits.
By reading these signs, you essentially tap into collective sentiment. This insight helps you decide whether to enter, hold, or exit a position. In volatile markets like the JSE, that edge can be the difference between bagging a tidy profit or sitting with losses.
Patterns also reveal how supply and demand balance out in the market. When prices bounce repeatedly off a support level, it shows demand outweighs supply there. Conversely, repeated failure to breach resistance signals supply pressure.
Consider the double bottom pattern—a clear sign buyers have stepped up after previous weakness, which may prompt further price gains. Understanding these underlying forces helps you gauge how strong a price move might be, assisting in better risk management.
Good chart pattern books condense years of market wisdom into organised knowledge that's tough to pick up solely from watching charts. Titles like John Murphy's Technical Analysis of the Financial Markets offer structured explanations, detailed examples, and practical tips grounded in real-world trading.
By studying these works, South African traders gain a solid foundation to avoid costly mistakes and identify patterns that matter rather than chasing phantom signals.
Different authors sometimes describe patterns a bit differently or emphasise unique methods. Thomas Bulkowski’s Encyclopedia of Chart Patterns introduces statistical success rates for each pattern, while Steve Nison’s Japanese Candlestick Charting Techniques explains the psychology behind candlestick formations.
Weighing these perspectives lets you craft an approach tailored to your style. For example, combining Bulkowski’s data-driven insights with candlestick readings may improve the quality of your entries.
Books predominantly reflect global markets, but applying concepts locally requires adjustment. The JSE, for instance, varies in liquidity and volatility compared to New York or London markets. This affects how reliably certain patterns play out.
Local guides or supplementary resources help bridge this gap. They adjust textbook patterns for South African market rhythms, factoring in things like rounds of loadshedding or lower trading volumes in some stocks. This localized insight is particularly valuable when plotting your trades.
Understanding chart patterns isn’t just about shapes on a screen; it’s about reading the market’s shifting moods and forces. Learning from trusted books, adjusted for your trading environment, sharpens your analytical edge and builds confidence in your decisions.
Recognising common chart patterns is essential for traders and investors aiming to grasp market movements and potential price shifts. These patterns give clues about the market’s next direction, based on how price behaves over time. Catching them early can be the difference between a smart entry or exit and missing out.
The Head and Shoulders pattern signals a likely reversal of an existing trend. It forms with three peaks: a higher middle peak (the head) flanked by two lower peaks (the shoulders). For example, on a JSE-listed share like Sasol, spotting a Head and Shoulders at the top of a bull run might hint that bears are gaining strength, suggesting a potential sell.

Traders look for the neckline—a straight line connecting the lows between the shoulders. Breaking this neckline confirms the reversal, often triggering a drop. It’s a valuable warning sign to tighten stops or prepare an exit.
Double Tops and Bottoms are simpler reversal patterns. A Double Top happens after a price rises, hits resistance twice around the same level, and then drops. Look at a stock like Naspers that flattens at R3,500 twice but fails to break higher—this signals sellers stepping in.
Conversely, a Double Bottom forms when price falls, finds support twice near the same level, then bounces upward. These patterns suggest the market is struggling to push beyond a certain price range, providing traders with clear areas to place stops or entries.
Triple Tops and Bottoms are similar to their double counterparts but feature three tests of resistance or support. They strengthen the reversal signal compared to doubles, implying greater conviction among market participants.
For instance, if a Rand hedge counters its declines by hitting a bottom three times near R150 and then rises, it underlines strong buying interest. Traders may use this to confirm the reversal before committing funds.
Triangles reflect market indecision and typically signal continuation of the current trend. A symmetrical triangle forms when price swings tighten between converging trendlines, showing balance between buyers and sellers. Once price breaks out, momentum resumes—think of a stock like Aspen Pharmacare breaking upwards after a triangle.
Ascending triangles have a flat resistance line with rising lows, indicating bulls inching higher. Descending triangles, with flat support and falling highs, point to bears pressing down. Recognising which triangle you're seeing helps you guess where price could move next.
Flags and pennants appear as brief pauses after strong price moves, like a short rest before the next sprint. Flags look like small rectangles trending against the prior move, while pennants are small symmetrical triangles. Both highlight traders catching their breath before momentum picks up again.
For example, after a sharp rise in an MTN share price, spotting a flag could mean a quick consolidation before it resumes climbing. Timely entries here can be rewarding.
Rectangles indicate sideways trading: price bounces between clear support and resistance zones. This pattern shows market indecision but also sets clear boundaries.
A share like Shoprite might trade between R140 and R150 for weeks, forming a rectangle. Watching for a breakout above or below helps signal the next move. These patterns assist in planning trades with clear risk levels by setting stops just outside the rectangle.
Mastering these common patterns lets traders anticipate possible moves instead of reacting blindly. Combining pattern recognition with volume and other tools enhances decision-making in the fast-moving South African markets.
Using chart patterns effectively can make a real difference in trading outcomes. Patterns are not just pretty shapes on a graph; they reflect trader behaviour and market psychology. However, spotting them alone won’t cut it. The key is to confirm their validity, time your trades right, and manage risk carefully.
Volume is a helpful yardstick when confirming chart patterns. For example, an ascending triangle breaking out on low volume might be a false signal, while a surge in volume confirms genuine interest. Increased volume during a breakout suggests many traders backing the move, adding weight to the pattern’s prediction.
In South African markets like the JSE, where liquidity can vary by stock, volume confirmation is especially useful. For instance, a small-cap stock showing a head and shoulders pattern might need a volume spike to rule out random price moves.
Patterns can look very different depending on the time frame. A head and shoulders pattern on a daily chart carries more weight than one seen on a 15-minute chart, which might be noise. Longer time frame patterns tend to reflect stronger market sentiment and tend to be more reliable.
Traders should align pattern recognition with their trading style—day traders focus on short-term charts, whereas investors prefer weekly or monthly charts. Understanding time frames prevents misreading short-lived formations as major trends.
One common pitfall is seeing patterns where none exist, often called “pattern hallucination.” Traders might force interpretations just to justify a trade. This can lead to poor decisions based on wishful thinking.
Ignoring the broader market context also causes errors. For instance, a bullish pattern in a clearly downtrending market might not play out as expected. The danger of confirmation bias also creeps in when traders only focus on data supporting their view, neglecting contradicting signals.
Chart patterns can guide precise entry and exit points. For example, after spotting a double bottom, entering the trade soon after the price breaks above the peak between the two lows can be a smart move.
Exit points can be set based on pattern targets — measuring the height of a head and shoulders formation and subtracting it from the breakout point to estimate how far the price might fall. This method helps in planning trades with clear profit goals.
Stop-loss orders protect capital if a pattern fails. For instance, placing a stop just below the neckline of an inverse head and shoulders can cap losses if the breakout reverses.
Stops should be tight enough to prevent big losses but allow some room for normal price swings. This balance is essential, especially in volatile South African stocks potentially affected by local news or loadshedding fears.
To reduce false signals, combining chart patterns with technical indicators improves confidence. For example, pairing a bullish pennant breakout with RSI (Relative Strength Index) moving above 50 suggests stronger momentum.
Another common combo is using moving averages to confirm trend direction before entering a trade based on a pattern. Indicators like MACD (Moving Average Convergence Divergence) can also signal if momentum aligns with the anticipated pattern move.
Effective use of chart patterns comes down to validation, context, risk management, and smart integration with other tools. This approach helps traders avoid common traps and better time their trades.
Applying these clear techniques will sharpen your ability to trade South African shares or other assets with more discipline and confidence.
Understanding chart patterns deeply requires more than just observation; it calls for reliable resources to guide traders through the complexities of market behaviour. Recommended books serve that purpose well, offering proven insights, tested strategies, and frameworks developed by experienced analysts. These texts not only explain pattern formations but also bring practical examples that traders can relate to, helping to avoid common pitfalls.
‘Technical Analysis of the Financial Markets’ by John Murphy offers a comprehensive foundation for traders at all levels. Murphy’s book breaks down various chart patterns and technical indicators using clear language and detailed examples. Its practical relevance lies in how it bridges theory and real-world trading, making complex concepts accessible. For instance, Murphy discusses how volume tends to confirm patterns like head and shoulders or triangles, which directly aids in validating trade signals.
‘Encyclopedia of Chart Patterns’ by Thomas Bulkowski is a go-to source for in-depth pattern statistics and performance analysis. Bulkowski compiles historical data of numerous patterns, scoring their reliability and typical price targets. His methodical approach equips traders with expectations about success rates and breakout behaviours. That makes it especially useful for refining risk management and setting realistic profit targets.
‘Japanese Candlestick Charting Techniques’ by Steve Nison introduces readers to the visual language of candlestick charts, which originated in Japan centuries ago. Candlestick patterns reveal market sentiment nuances often missed by bar or line charts alone. Learning Nison’s techniques helps traders recognise early reversals or continuations within a single trading session. This book is particularly practical for those who want to combine candlestick signals with traditional chart patterns.
Localised Trading Guides focus on tailoring general technical analysis to South African conditions. These books address market peculiarities such as the effect of Eskom’s loadshedding on intraday volatility or how local economic events influence the JSE. They provide grounded advice on adjusting pattern analysis to factors like fluctuating liquidity and currency swings.
Adapting Global Concepts to the JSE discusses how universal charting principles can be fine-tuned for South Africa’s stock market. For example, it explores differences in sector behaviour — mining stocks versus financials — and the impact of regulatory changes. This helps traders apply global best practices without ignoring local market structure.
How to Use Chart Patterns in South African Markets offers direct, actionable tips on spotting patterns on JSE-listed shares and indices. It highlights typical formations seen on popular shares like Sasol or Shoprite and explains how to combine chart patterns with local economic news or SARB announcements. This practical guide bridges textbook theory with South African market realities.
Learning chart patterns through trusted books can significantly boost your trading confidence and decision-making. Whether you're starting out or refining your method, these resources keep you anchored in both solid theory and everyday market conditions.
By focusing on these recommended books, traders gain a solid grounding in chart pattern recognition and learn how to adapt these insights to South Africa’s unique markets, giving them a competitive edge.
Chart patterns are powerful tools, but they come with pitfalls that can lead traders astray. Understanding these common mistakes is key to sharpening your trading edge and avoiding costly errors.
Relying solely on chart patterns without considering the wider market environment often leads to poor decisions. For example, a head-and-shoulders pattern signalling a reversal might appear in a strong bull market, where fundamentals still support price gains. Without checking economic news, sector health, or overall market sentiment, you risk acting prematurely. South African traders should remember how Eskom-related power cuts or Reserve Bank interest rate shifts can override technical signals.
It’s tempting to spot familiar shapes in price charts, but impressions can be misleading. This is called ‘chart pattern illusion’, where random price movements mimic known patterns. For instance, a triangle pattern may appear by coincidence during volatile periods, yet it doesn't lead to the expected breakout. Avoid this trap by confirming patterns with volume changes and multiple timeframes. Patience prevents chasing false signals.
Confirmation bias occurs when traders focus on data supporting their expectations and dismiss contradictory evidence. If you believe a bullish flag pattern means a price rise, you might ignore signs of weakening volume or negative news. This bias can cloud judgement and increase risk. Being aware of it encourages critical analysis and prevents self-deception in trading.
Patterns gain strength when paired with fundamental factors. Say a continuation pattern forms in a mining company share, but commodity prices are tanking globally. The fundamental backdrop suggests caution. Blending technical and fundamental insights creates a fuller picture, improving trade quality.
Chart reading is a skill refined over time. Review your trades frequently to spot recurring mistakes or patterns that work well in specific contexts. Practise with historical charts and simulate trades to build confidence. South African markets can be influenced by local events like political developments or currency volatility, so keeping practice grounded in real conditions helps.
Keeping a trading journal helps track which patterns deliver consistent results and which fall short. Note down entry and exit points, pattern types, and outcomes. Over time, this record highlights your personal edge and areas to improve. It also keeps emotions in check by providing objective feedback.
Avoiding common pitfalls is less about luck and more about discipline and clear-headed analysis. By respecting market context, questioning your biases, and combining multiple approaches, you’ll make chart patterns a useful part of your trading toolkit.
📊 Learn to identify key chart patterns for smarter trading decisions. Includes reliable formations and handy PDF guides to boost your market strategy locally.

📊 Master forex chart patterns to spot market trends and trade smarter. Learn practical skills tailored for South African traders with clear, useful tips 🇿🇦
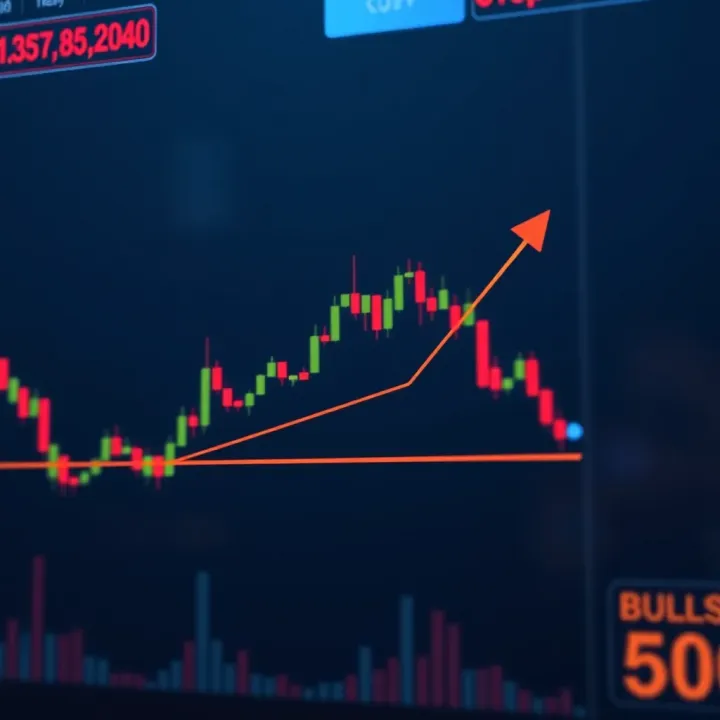
📈 Learn to spot bullish chart patterns like ascending triangles and double bottoms to boost your trading and investing edge in South Africa’s markets. 💹

📊 Learn how to read and interpret candlestick chart patterns for smarter trading decisions. Understand key patterns, their uses, and practical tips to boost your market analysis.
Based on 7 reviews