

Understanding Forex Trading Systems
🔍 Discover how forex trading systems work, key strategies, and risk management tips to trade smarter in South Africa’s forex market. 💹
Edited By
Henry Walker
Forex chart patterns offer a straightforward way to read price movements on charts, giving traders clues about what could come next. These patterns are visual formations created by price actions over time on forex charts. Recognising them helps traders sketch probable market directions without relying purely on complex indicators.
In markets like forex, which can be unpredictable, patterns such as triangles, head and shoulders, and double tops or bottoms provide insights into potential trend changes or continuations. For example, a head and shoulders pattern often signals a reversal from a bullish to bearish trend. Spotting such a formation early can save you from holding onto a losing position.

Practical knowledge of chart patterns can sharpen your decision-making, helping you know when to enter or exit trades. But remember, no pattern guarantees success.
South African traders have to consider unique challenges like the impact of loadshedding on internet access, which might disrupt timely execution of trades. Chart patterns can be helpful here, as they often form over days rather than minutes, allowing a bit more flexibility.
Visual clarity: Patterns are easier to spot than memorising complicated indicator readings.
Trend prediction: Patterns often indicate whether a trend will continue or reverse.
Risk management: Helps set stop-loss and target levels more effectively.
Triangles: Indicate consolidation before a breakout.
Head and Shoulders: Signals trend reversals.
Double Top/Bottom: Suggests testing of price levels followed by a change.
Understanding these basics will allow you to trade with more confidence and less guesswork. The key, though, is combining chart patterns with other tools like volume and support/resistance lines — not using them in isolation.
In the sections ahead, we'll break down how to identify these patterns specifically in a forex context, with tips tailored to South African traders navigating both local and global market influences.
Understanding forex chart patterns is a cornerstone of successful forex trading. These patterns offer visual cues about where the market might be heading next, helping traders make informed decisions rather than relying on gut feeling alone. For instance, when a trader spots a clear "head and shoulders" pattern on a chart, it often points to an impending reversal, allowing them to adjust their trades accordingly.
Chart patterns also distil complex price movements into recognisable shapes, making it easier for traders to interpret market behaviour without getting drowned in data. This is especially useful in the fast-paced world of forex where currency pairs react quickly to global events and economic data. Getting a grip on these patterns equips you to spot potential entry and exit points with more confidence.
Price action is essentially the raw movement of price over time, free from lagging indicators or complex algorithms. It reveals the battle between buyers and sellers, showing who’s currently in control. A sharp upward move followed by smaller pullbacks, for example, signals strong buyer interest, while volatile swings can imply indecision or uncertainty.
In practice, traders watch price action closely to time their trades. For example, seeing a series of higher highs and higher lows on a chart hints at a bullish trend, encouraging traders to look for buying opportunities. Price action is the purest language of the market—it tells you what participants are doing right now.
Chart patterns act as a mirror reflecting market psychology. A double top formation, where price hits a resistance level twice before falling, suggests traders are hesitant to push the price higher, signalling bearish sentiment. Conversely, a triangle pattern often represents consolidation and indecision before the market breaks out, showing that sentiment is poised to shift.
By recognising these visual cues, traders glean insights about the mood in the market—optimistic, cautious, or nervous. It’s not just about the shape but what traders collectively feel and expect, which influences price movements.
Three main types of charts dominate forex trading. Line charts are the simplest, which connect closing prices over a period, giving a quick overview of price trends. Bar charts provide more detail, displaying open, high, low, and close prices for each interval, useful for spotting volatility.
Candlestick charts are most popular in South African trading circles. Each candle shows opening and closing price as the body, while the wicks indicate extremes within the period. Their colours and shapes make spotting reversals or continuations more intuitive. For instance, a long wick on a downward candle might hint at rejection of lower prices.
The timeframe you choose to analyse will shape what patterns you see and how you interpret them. Shorter timeframes like 5 or 15 minutes show quick moves ideal for day traders, but can be noisy and unpredictable. Longer periods such as daily or weekly charts smooth out minor price swings, revealing more reliable, bigger-picture trends.
A South African trader studying rand futures might use a 1-hour chart during active market hours, then check daily charts to confirm trend strength. Picking the right timeframe helps avoid chasing false signals and aligns your strategy with your trading style.
Chart patterns are not foolproof, but when combined with smart timeframe choices and clear price action reading, they become powerful tools for navigating the forex market efficiently.
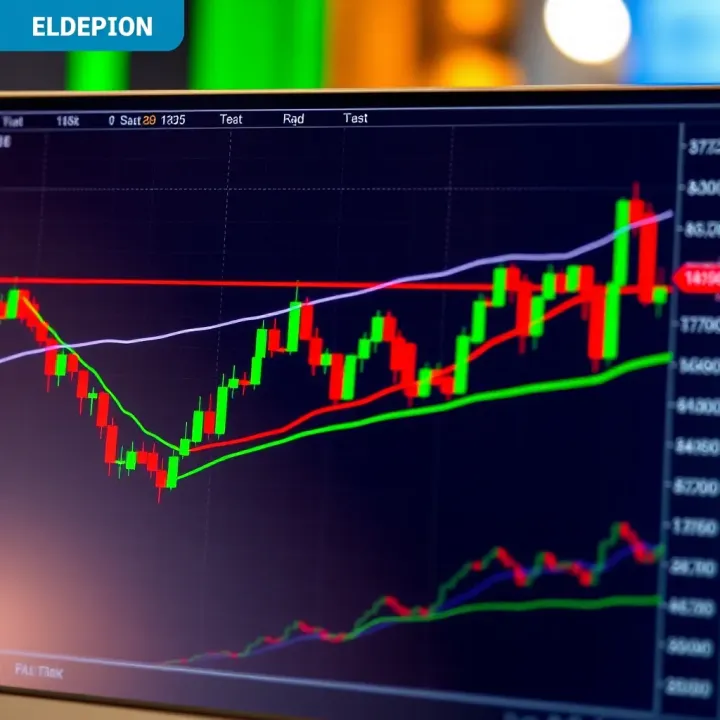
Understanding key forex chart patterns is essential for any trader aiming to anticipate market movements effectively. These patterns offer visual clues about price trends, helping you decide when to enter or exit trades. Recognising patterns sharply improves your ability to predict reversals or continuations, cutting through the noise of daily price fluctuations.
The Head and Shoulders pattern signals a potential change in trend direction. It forms after an uptrend with three peaks: the middle peak (head) taller than the two shoulders on either side. When the price breaks below the neckline connecting the two valleys, it usually indicates the start of a downtrend. This pattern’s practical value lies in its reliability for spotting reversals, allowing traders to exit long positions early or prepare for short trades.
Double Tops and Bottoms show where price tests a level twice but fails to break through convincingly. A Double Top forms after an uptrend and suggests a bearish reversal when the price drops below the support formed between the two peaks. Conversely, a Double Bottom appears after a downtrend, hinting at a bullish reversal once the price breaks above the resistance level. For traders, these patterns are straightforward signals to manage risk and adjust positions accordingly.
Unlike Double Tops/Bottoms, Triple Tops and Bottoms involve three attempts to break a price level, making the pattern even stronger. The Triple Top warns of a likely downward move if the price falls below the support zone, while the Triple Bottom points to an upward move if resistance is broken. Given the rarity and clear signals, spotting these patterns can improve timing and confidence in trade decisions.
Triangles form as price consolidates, reflecting a battle between buyers and sellers. An ascending triangle has a flat resistance line and rising support, hinting at a bullish breakout. A descending triangle features a flat support and declining resistance, signalling a bearish breakout. Symmetrical triangles, where support and resistance converge equally, usually precede a breakout in either direction. These patterns help traders anticipate continued moves following consolidation phases and plan entries accordingly.
Flags and pennants appear as small consolidations after sharp price moves, resembling a flag or small triangle on the chart. They indicate temporary pauses before the prior trend resumes. A bullish flag following a strong rally or a bearish flag after a drop shows traders that the market is gathering momentum for the next leg. Recognising these allows allocating positions for swift market movements rather than being caught flat-footed.
Rectangles form when price trades sideways between clear support and resistance levels, marking a period of indecision. Breakout direction from the rectangle often signals a strong move, so watching for these breaks provides practical insight into next moves. Trading within the rectangle can offer minor gains through range trading, but bigger profits come from identifying the breakout early.
Key chart patterns like these serve as a compass in the often chaotic forex market, guiding traders toward smarter, more informed decisions rather than guesswork.
Mastering these patterns adds a practical edge in reading markets and managing trades effectively, particularly when combined with volume and indicator analysis.
Interpreting chart patterns effectively is more than spotting shapes on a graph; it involves understanding what these patterns signal about market behaviour and confirming their reliability before making trading decisions. For forex traders, this skill can be the difference between jumping into a trade prematurely or waiting for stronger confirmation, which helps manage risks in a volatile environment like the rand forex market.
Trading volume shows how many units of a currency pair are exchanged during a specific period. It’s a solid indicator of the strength behind a price move. For example, a breakout from a triangle pattern is more trustworthy if it’s accompanied by a surge in volume. Without that, the breakout might be a false signal, and prices could easily reverse. Traders often overlook volume, yet it can prevent costly mistakes by signalling genuine market interest.
Indicators like the Relative Strength Index (RSI), Moving Average Convergence Divergence (MACD), and moving averages add another layer to pattern confirmation. Suppose you identify a head and shoulders reversal pattern; if the RSI shows overbought conditions and the MACD confirms a bearish crossover, it gives more weight to the signal. Moving averages can help confirm trend direction—when price breaks a pattern and crosses a key moving average, it strengthens the case for entry or exit. Relying on these indicators alongside chart patterns offers a clearer picture, reducing guesswork.
Misreading chart patterns is a common pitfall. Patterns can be subjective, and traders might mistake random price movements for established shapes. For instance, calling a small wobble a double bottom doesn’t carry the same weight as a properly formed one that meets pattern criteria. This often leads to poor timing and losses. Familiarity with the precise structure of patterns and sticking to validated definitions can help avoid this.
Depending on chart patterns alone, without considering broader context, is risky. A bullish flag in a weak market or during Eskom-induced loadshedding might not perform well because external factors affect market momentum. Macro factors, political events, and rand volatility can skew typical patterns. Traders who ignore the bigger economic picture may find chart signals misleading. Integrating chart patterns with news, fundamental analysis, and volume data paints a fuller market story.
Remember, chart patterns aren’t crystal balls; they’re clues. Checking these clues with volume and indicators, and understanding the broader context, makes your trading clearer and more reliable.
By paying close attention to volume and indicator alignment, and avoiding common pitfalls like pattern misidentification and context neglect, you can interpret forex chart patterns much more effectively. This skill enables better-informed trades that can handle the fluctuations unique to South African forex markets.
Using chart patterns in your forex trading isn't just about spotting potential moves — it's about having a clear game plan. Patterns give you clues on when to jump in (entry) and when to get out (exit), helping you trade with more confidence rather than guesswork.
Entry and exit strategies are the backbone of any trading plan based on chart patterns. For example, a trader spotting a bullish ascending triangle might wait for the price to break above the resistance level before entering. This break often signals momentum picking up. Conversely, exits could be planned near previous highs or support levels to lock in profits. Crucially, combining the pattern with other indicators like volume spikes confirms the signal, reducing false entries.
When it comes to risk management specific to pattern trading, setting stop-loss orders just below key pattern points can protect you if the market moves against you. Let’s say you enter after a head-and-shoulders breakout; placing stops beyond the right shoulder low limits potential losses. Proper position sizing based on your total account prevents a single trade from wiping out your gains. Effective risk control helps you stay in the game even when patterns fail, which they sometimes will.
Choosing the right local broker platforms and charting tools matters a lot. South African traders often lean on brokers like IG Markets SA, Standard Bank Online Trading, or EasyEquities for access to reliable platforms with decent charting features. Having advanced charting tools that support pattern recognition, indicators, and multiple timeframes helps you confirm your setups faster and trade more efficiently.
The impact of rand volatility on pattern reliability can’t be overlooked. The rand often moves sharply due to domestic economic news or global risk sentiment, making patterns less predictable at times. For instance, a classic reversal pattern might fail because of a sudden rand tumble triggered by a SARB rate decision. South African traders should factor in such macro events when interpreting patterns and avoid over-trading during periods of extreme rand swings.
Patterns are tools, not guarantees. But with the right plans and local context, they become valuable aids in navigating the rand’s rocky terrain.
Trading forex with chart patterns takes practice and patience, especially here in South Africa where market quirks come into play. Focus on solid entry and exit rules, protect yourself with smart risk management, and keep an eye on local market dynamics to sharpen your results.
Finding trustworthy and current resources on forex chart patterns is key to trading success. Without accurate material, it’s easy to misread market signals or stick to outdated strategies. Knowing where to look saves time and sharpens your analysis skills, especially in volatile markets like South Africa’s rand.
When selecting PDF guides, focus on the publication date and the author’s credentials. Markets evolve quickly, so materials from five or more years ago may contain insights that no longer apply. Look for guides authored by experienced traders or financial analysts with a track record in forex trading.
Also, check for practical examples and clear explanations that avoid jargon. A useful guide doesn’t just list patterns but explains their context, reliability, and how South African market conditions might affect outcomes. For instance, a guide that notes how rand volatility impacts price patterns adds valuable local relevance.
Several reputable brokers and financial education sites offer free downloadable PDFs on chart patterns. These can be a good starting point but often cover basics only. Paid downloads from known trading academies or market experts usually provide deeper insights, examples, and regular updates.
For South African traders, platforms like IG South Africa or local market educators sometimes publish such resources. Investing in well-reviewed paid guides is often worthwhile, as they tend to include updates reacting to recent market shifts, enhancing your trading edge.
Joining local forex forums and social media groups can expose you to practical, real-world insights. Platforms such as the MyBroadband Forex section or South African trading groups on Facebook offer peer discussions, grassroots tips, and pattern spotting shared by fellow traders who understand local market nuances.
Engaging in these communities helps avoid costly mistakes when those around you highlight recent pitfalls or pattern anomalies linked to events like Eskom loadshedding or SARB policy shifts. Always cross-check advice but remain open to different viewpoints.
Interactive learning through courses or webinars offers structured knowledge and direct access to professional mentors. Look for providers offering sessions tailored to South African traders or with a global forex emphasis adaptable to local conditions.
These formats allow you to ask questions in real time, practice pattern recognition on live charts, and stay updated on technical tools aligned with current market trends. Providers like the SA Forex Academy or international platforms with South African support often run webinars designed to suit both beginners and seasoned traders.
Having reliable, locally relevant resources to study forex chart patterns means you can trade with more confidence and fewer surprises. Assess each source for quality and relevance, then combine theoretical knowledge with community wisdom and practical learning to sharpen your trading edge.
🔍 Discover how forex trading systems work, key strategies, and risk management tips to trade smarter in South Africa’s forex market. 💹
Learn about halal forex trading 📈, key Shariah compliance principles, practical strategies, and how Muslim traders in South Africa navigate ethical forex markets.

🌍 Learn how different Forex trading sessions affect market moves and volatility. Master session timing to sharpen your trading skills and manage risks better.

📊 Learn to spot hammer candlestick patterns to spot potential trend shifts in trading. Understand variations & use them with other tools for smarter trades.
Based on 13 reviews