
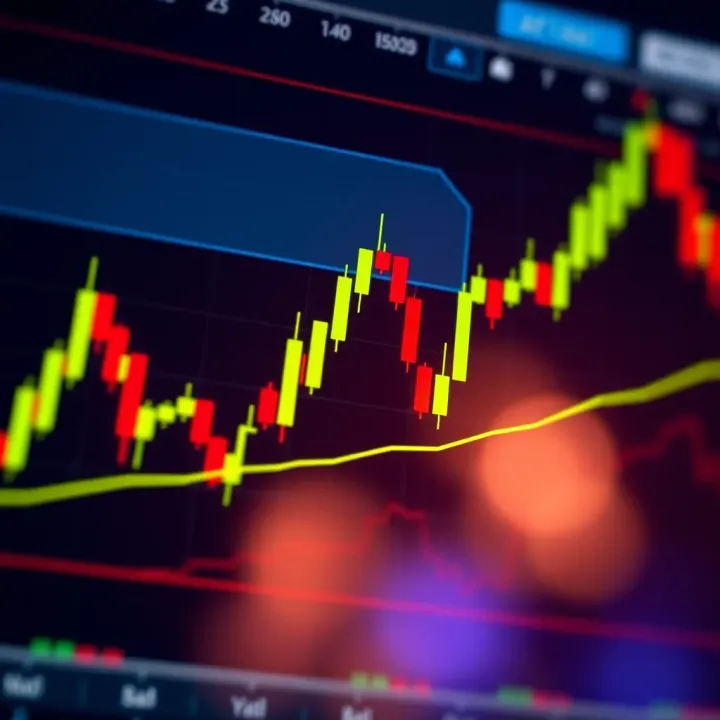
Candlestick Chart Patterns for Smarter Trading
📊 Learn how to read and interpret candlestick chart patterns for smarter trading decisions. Understand key patterns, their uses, and practical tips to boost your market analysis.
Edited By
Jessica Palmer
Candlestick patterns form a key part of technical analysis in trading and investing. They provide visual cues that help traders predict market trends, spot reversals, or confirm ongoing momentum. Understanding these patterns can unlock practical advantages when navigating South African markets like the JSE or forex platforms.
These patterns display price movements within a specific timeframe, showing the open, close, high, and low prices of an asset. Unlike simple line charts, candlesticks reveal more nuanced information, making price action easier to interpret at a glance.

Remember: Candlestick charts don’t guarantee outcomes but help you make informed decisions by recognising likely scenarios.
Candlestick patterns can be grouped mainly into two categories:
Single Candlestick Patterns: Patterns formed by just one candlestick, such as the Doji or Hammer, signalling indecision or potential reversals.
Multi-Candlestick Patterns: Formed by two or more candles, examples include the Engulfing pattern and Morning Star, often indicating stronger trend changes.
Each pattern reflects different trader sentiments, which you can relate to the ebb and flow of buyer and seller pressure.
When reading candlesticks:
Check the candle body: The longer the body, the stronger the buying or selling action.
Look at shadows/wicks: Long shadows suggest price rejection and possible reversals.
Consider context: Patterns within support and resistance zones or alongside volume spikes gain reliability.
For example, a bullish Hammer near a support region can highlight a higher chance of an upward bounce.
With local factors such as Eskom loadshedding affecting market confidence, reading candlestick patterns helps traders time entries and manage risks more effectively. Whether trading local shares, forex pairs like ZAR/USD, or commodity futures, these patterns offer timely signals.
PDF cheat sheets summarising major candlestick patterns offer handy, offline tools for traders. They organise key patterns with clear visuals and brief descriptions for rapid recognition during live trading sessions or study time.
In the following sections, you'll find detailed explanations of high-impact candlestick patterns, illustrated with real-world South African market examples along with links to downloadable PDF resources for practical use.
Candlestick patterns are visual tools that traders use to understand price behaviour in financial markets. They matter because these patterns help reveal shifts in buying and selling pressure, offering clues about potential future moves. For example, spotting a "hammer" candlestick after a downtrend might signal a possible market reversal, allowing traders to position themselves advantageously.
Candlestick charts originated in Japan during the 18th century, created by a rice trader named Munehisa Homma. He developed a method to track price fluctuations more visually than simple line charts. This approach remains relevant today because it captures not only the price but also the psychology behind market movements.
Each candlestick on these charts represents the price action for a specific time period—be it a minute, an hour, or a day. This makes reading market trends more intuitive, especially when combined into patterns. Traders rely on these visual cues to understand whether buyers or sellers dominated during that interval.
The candlestick consists of four key components: the open, close, high, and low prices. The 'body' of the candle spans from the opening to the closing price, showing whether the price moved up or down. The thin lines, known as wicks or shadows, indicate the highest and lowest prices reached. Recognising these parts helps traders interpret market sentiment precisely, for instance, by identifying narrow or long candles that may suggest indecision or strong momentum.
Traders use candlestick patterns because they provide a snapshot of market psychology quickly, signalling shifts before price moves too far. These patterns act as a shorthand for gauging whether the market is likely to continue on its current path or reverse. For example, the bullish engulfing pattern, where a white candle completely covers the previous black candle, suggests that buyers have gained control.
Patterns also reflect collective sentiment, capturing emotions like fear, greed, or hesitation. A doji pattern, where opening and closing prices are almost the same, usually points to indecision in the market—traders might hesitate to commit, awaiting more information.
That said, candlestick patterns come with limitations. Relying solely on them can be risky, as patterns sometimes give false signals, especially in volatile markets. For instance, a hammer might form in a strong downtrend without leading to a reversal. Traders should therefore confirm patterns with other tools like volume analysis or trendlines to avoid costly mistakes.
Understanding both the strengths and weaknesses of candlestick patterns helps you make smarter, more cautious trading decisions rather than acting purely on instinct.
In the South African context, recognising these patterns amid fluctuating rand values and events like Eskom loadshedding demands a clear grasp of their practical use and limits. This foundation prepares traders and investors to integrate candlestick analysis effectively with broader market insights.
Understanding common candlestick patterns is key for making sense of price movements in any market. These patterns give traders quick insights into market sentiment and potential reversals or continuations. Familiarity with them lets you react faster and make better-informed decisions, especially when combined with other indicators.
A Doji occurs when a candlestick's open and close prices are virtually the same, signalling indecision among traders. It looks like a cross or a plus sign, showing that neither buyers nor sellers took control during the session. In practice, a Doji near a support or resistance level might hint at a potential reversal, but it shouldn’t be taken as a standalone signal.
Both Hammer and Hanging Man have small bodies with long lower shadows. The Hammer appears after a downtrend and suggests a possible bullish reversal, as sellers pushed prices down during the session but buyers regained control by close. Conversely, the Hanging Man shows up after an uptrend and warns of a potential bearish reversal. Identifying where these patterns appear relative to the trend is essential for traders.

The Spinning Top features a small body with long upper and lower shadows, indicating a tug-of-war between buyers and sellers without a clear winner. This usually points to market hesitation and can signal a slowdown or pause in the current trend. For example, a Spinning Top after a strong rally could mean traders are uncertain about prices rising further.
Bullish Engulfing appears when a small red (bearish) candlestick is followed by a larger green (bullish) one that completely covers the previous candle's body. This shows buyers overpowering sellers, often signalling a trend reversal upwards. The opposite happens with Bearish Engulfing, where a large red candle swallows a smaller green one, warning of potential downside.
These three-candle formations offer clearer clues on turning points. The Morning Star signals a bullish reversal, starting with a long red candle, followed by a small-bodied candle that gaps down, and a strong green candle closing well into the first candle’s body. The Evening Star flips this, indicating a bearish reversal. Traders often look for volume confirmation to strengthen the signal.
The Three White Soldiers pattern features three consecutive long green candles with rising closes, implying strong buying momentum. It often indicates the start of a solid uptrend. The Three Black Crows are its bearish counterpart—three successive long red candles with falling closes, suggesting sellers are taking firm control. These patterns work best after clear trends or consolidations.
Recognising these patterns can give you a practical edge in reading charts. However, always confirm with trend context and volume to avoid misleading signals.
Knowledge of these formations helps traders anticipate market moves, manage risk better, and time entries or exits more effectively. Having quick reference PDFs summarising these patterns can be a handy asset when analysing charts on the fly.
Reading candlestick patterns correctly requires more than spotting shapes on a chart. Patterns must be viewed within the wider market context to provide useful signals. Doing so helps traders anticipate price movements with better confidence and avoid common pitfalls that come from isolated or out-of-context readings.
A candlestick pattern’s significance depends heavily on the trend it appears in. For instance, a bullish engulfing pattern suggests a potential reversal when found at the bottom of a downtrend, but might carry little meaning during a sideways market. Trendlines drawn alongside the chart help confirm whether the pattern aligns with an established upward or downward trend, strengthening the trade signal.
For example, if the JSE all-share index shows a clear downward trend and a hammer candlestick forms near support levels, this reinforces the chance of a reversal. Ignoring trend direction often leads to false positives or misjudged trades.
Volume acts as extra proof that a candlestick pattern has market backing. A volume spike accompanying a bullish or bearish pattern typically shows stronger conviction among traders. Conversely, if volume is thin, the pattern could lack credibility.
Say you spot a morning star pattern on a local share like Sasol. If accompanied by above-average volume, it signals increased buying interest and potential price recovery after a drop. On the other hand, weak volume tells you to be cautious, as the signal may not sustain a breakout or reversal.
Candlesticks should not stand alone; other indicators can confirm or reject the signal. Moving averages, RSI (Relative Strength Index), and MACD (Moving Average Convergence Divergence) provide context such as momentum direction and overbought or oversold conditions.
Imagine a doji forming while the RSI is at an extreme oversold level—this combination strengthens the case for a coming bounce. However, if other indicators show conflicting information, it’s wise to hold back before making trading decisions.
Many traders jump into trades based on candlestick setups alone without waiting for confirmation from trends or indicators. This often leads to losses since patterns can fail or be misleading. Confirmation reduces the risk of falling into traps like fake breakouts.
Consider when a Hammer forms on a share price but the trend remains strongly bearish. Entering a buy trade on this sole pattern might backfire if the broader market ignores it.
Size and precise formation matter. A tiny bullish engulfing may not be as convincing as one with a large body that fully covers the previous bar. Similarly, shadows (wicks) indicate price rejection or volatility and should be accounted for. Overlooking these can make traders misinterpret upbeat signals as bearish, or vice versa.
For instance, confusing a hanging man and hammer due to similar shapes but different trend contexts is a rookie mistake.
Patterns occur in real markets affected by news, economic data, and sentiment shifts. Ignoring these factors leads to poor timing or flawed analysis. Say, a bullish pattern forms just as an unexpected interest rate hike hits local media—this kind of event can invalidate the technical signal.
Keeping abreast of local news, especially in South Africa where events like Eskom loadshedding or rand fluctuations can influence market sentiment, ensures pattern readings are grounded in reality.
Reliable trading comes from blending technical signals like candlestick patterns with volume, trendlines, other indicators, and current market information. This layered approach helps reduce risks and increases the chance of making sound decisions.
Having dependable PDF resources on candlestick patterns can give traders and investors a handy tool for quick analysis and reference. Instead of hunting through books or screens during trading hours, you have a compact guide that summarises critical patterns and their meanings. This saves time and helps avoid decision delays in fast-moving markets like the Johannesburg Stock Exchange (JSE). Reliable PDFs often offer clear visuals and concise explanations that make pattern recognition more straightforward.
Many reputable brokers, including those active in South Africa like EasyEquities or Standard Bank Online Share Trading, offer downloadable PDFs of candlestick patterns. These are usually well-curated and aligned with their platform’s trading tools. Using such official sources means you get materials vetted for accuracy and relevance to current market conditions. For instance, EasyEquities, popular among South African retail investors, provides educational material that includes candlestick pattern summaries designed to complement their user interface.
Several dedicated trading education sites, like Investopedia or local trading communities such as MyBroadband forums, provide free PDF guides. These often include printable charts and pattern explanations, making them accessible for beginners and intermediate traders alike. The practical advantage here is that these resources update regularly to reflect market changes, plus you can print and have a physical copy for study away from the screen.
Attending courses organised by South African financial educators often comes with extra learning materials, including comprehensive PDF handouts. These can be tailored to local market specifics and include examples from the JSE or local economic conditions. For example, a trading workshop in Johannesburg might provide participants with a PDF that not only covers candlestick basics but also factors in events like Eskom loadshedding and how that affects market patterns.
Once you have a reliable PDF, printing it out can turn it into a quick reference on your desk during trading sessions. Using a highlighter or coloured pens to mark important patterns allows faster recognition when you see similar shapes on live charts. This tactile method helps reinforce memory, especially when preparing for big market events or earning seasons.
If you prefer to keep your materials digital, tools like Adobe Acrobat Reader or other PDF editors let you add notes, underline, and bookmark key sections. This flexibility supports active engagement with the material, enabling you to customise your reference guide with personal insights or notes on how patterns played out in your recent trades.
PDF guides work best when used alongside real-time charting. Regularly reviewing the patterns and flipping through your PDF while watching live market movements improves your pattern spotting accuracy. This ongoing practice deepens your understanding of how candlestick patterns behave in different South African market conditions, improving confidence and decision-making.
Keeping reliable, easy-to-access candlestick pattern PDFs at hand makes your technical analysis more efficient, helping you trade smarter rather than harder in the often unpredictable markets.
Candlestick patterns offer valuable clues for trading in South African markets, but their use requires understanding local nuances. By recognising these patterns within JSE stocks and considering domestic economic factors, traders can improve timing and risk management. Moreover, unique challenges such as Eskom loadshedding affect market behaviour and must be factored into strategy.
The JSE Top 40 includes the most liquid and widely followed South African shares, such as Naspers, Sasol, and Standard Bank. Spotting familiar candlestick patterns here can help anticipate short-term moves influenced by broader economic trends. For example, a bullish engulfing pattern appearing on Sasol shares after a prolonged downtrend might signal a potential rally, especially when supported by rising buying volume.
Patterns in these blue-chip stocks often reflect local investor sentiment but are also affected by global market swings. Combining candlestick insights with knowledge of sectors—like mining or financials—helps traders gauge if a pattern is likely to play out or if external forces might override it.
South African markets react strongly to domestic economic news such as interest rate changes announced by the South African Reserve Bank (SARB), political developments, or fiscal policy updates. These events can create sharp reversals or extended trends visible in candlestick charts.
For instance, after a SARB rate cut, share prices may show hammer or morning star patterns indicating buying interest. But these patterns might be short-lived if underlying economic challenges—such as rising inflation or unemployment—persist. Traders should watch for confirmation signals and stay updated on local economic conditions to avoid misreading patterns.
Loadshedding often disrupts business operations, weighing on investor confidence and share price stability. During severe loadshedding stages, market volatility can increase, making candlestick patterns less reliable if analysed in isolation.
Traders might notice more erratic price action as companies in energy-intensive sectors suffer. To manage this, one can combine candlestick analysis with volume trends and news flow, avoiding impulsive trades during periods of grid instability. Patience and cautious position sizing become crucial till normal power supply is restored.
Candlestick patterns alone don't provide the full story. Pairing them with fundamental research on companies listed on the JSE improves decision-making. Understanding earnings reports, dividend announcements, and sector-specific risks helps validate whether a pattern signals a genuine opportunity.
For example, if a bullish pattern forms on Capitec shares and recent quarterly results show solid growth, it strengthens confidence in a potential upward move. This approach reduces reliance on technical indicators alone and acknowledges the importance of company health in price swings.
South African markets face distinct risks like currency volatility, political uncertainty, and regulatory changes affecting listed firms. These factors can cause sudden price jumps or breakdowns, sometimes without clear candlestick signals.
Investors should remain vigilant for headline-driven shocks, such as changes in mining royalties or amendments to the BEE codes, which may trigger unexpected market reactions. Keeping a wider perspective beyond chart patterns protects against overtrading based on technical setups that lack solid backing.
The rand's strength or weakness significantly impacts listed companies, especially exporters and importers. A weakening rand often boosts commodity producers’ share prices but raises costs for firms reliant on imported goods.
Candlestick patterns on shares like Anglo American can be influenced by rand fluctuations combined with global commodity prices. Traders watching these stocks should track the rand-dollar exchange rate along with chart patterns, adapting their strategies accordingly to avoid surprises caused by currency moves.
TIps: Always blend local economic insights with candlestick patterns to navigate the complexities of South African markets. This practical approach strengthens trading decisions amid volatility.
Understanding and applying candlestick patterns with attention to these local factors empowers South African traders to be more adaptive and responsive to market conditions.
📊 Learn how to read and interpret candlestick chart patterns for smarter trading decisions. Understand key patterns, their uses, and practical tips to boost your market analysis.

📊 Learn to spot hammer candlestick patterns to spot potential trend shifts in trading. Understand variations & use them with other tools for smarter trades.
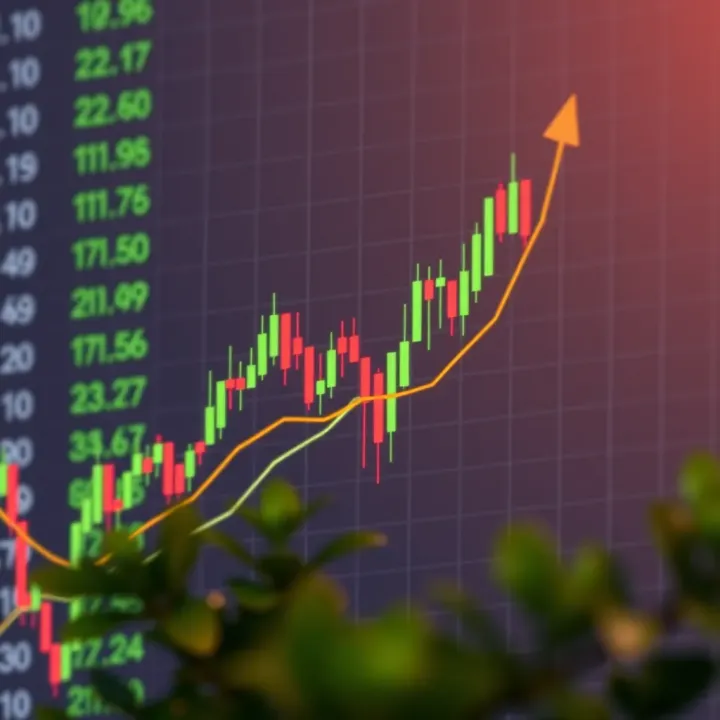
📈 Learn how key chart patterns from top trading books reveal market trends and price moves. Practical tips to boost your South African trading strategy today.
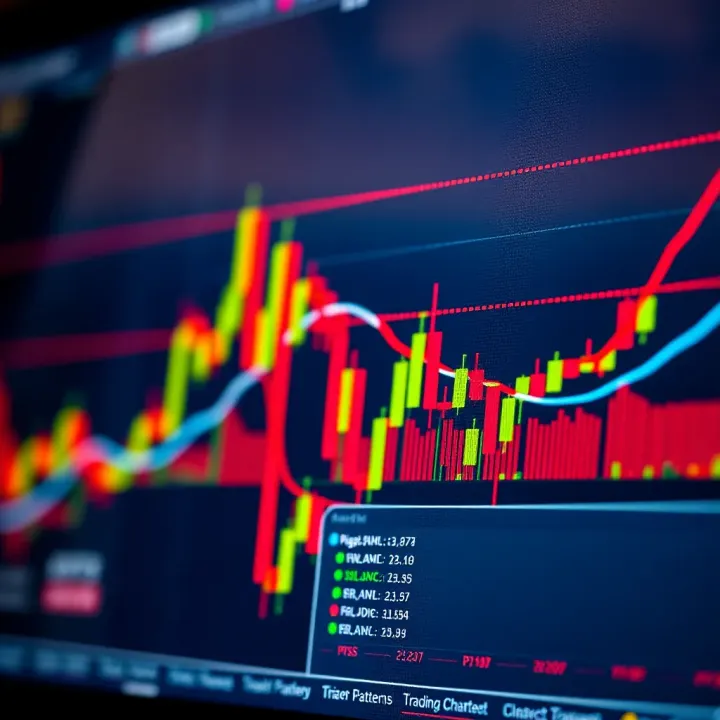
📊 Learn to identify key chart patterns for smarter trading decisions. Includes reliable formations and handy PDF guides to boost your market strategy locally.
Based on 12 reviews