

Best Forex Trading Indicators Explained
📈 Discover the best forex trading indicators! Learn how to use top tools, identify strengths, weaknesses, and combine them for smarter trades in South Africa.
Edited By
Thomas Green
Swing trading demands a sharp eye for spotting price trends and timely reversals amidst the noise of everyday market moves. For traders in South Africa, where market behaviour can be influenced by everything from global economic shifts to local factors like Eskom loadshedding or currency volatility, relying on the right indicators is vital.
Indicators serve as your navigational tools, helping you understand whether a stock or asset is gaining momentum, losing steam, or about to change direction. But not all indicators are created equal—and combining various types often gives a clearer picture than using just one.

Remember, no indicator predicts the market with 100% accuracy, but chosen wisely and applied consistently, they improve your chances of making smarter trades.
In this article, you'll find a guide through the top swing trading indicators widely used by successful traders. We’ll unpack how they function, why they matter, and how to blend them so you can better time your market entries and exits.
Alongside technical detail, there’ll be insights tailored to the South African market context—like how to adjust settings or interpret signals when local economic events or currency shifts come into play.
Here’s what you can expect in the sections ahead:
Overview of momentum indicators that highlight strength and pace of price movements
Trend-following tools to confirm the direction and durability of market swings
Oscillators that detect overbought or oversold conditions indicating potential reversals
Combining indicators for confirmation and reducing false signals
Practical tips on implementing these tools while considering South African market realities
By mastering these tools, you’ll be better equipped to navigate Mzansi’s markets and sharpen your swing trading strategy for solid, consistent action.
Swing trading aims to capture short- to medium-term price movements, typically holding positions from a few days up to several weeks. Unlike day trading, which requires constant market watching, swing traders seek to benefit from market swings or trends that develop gradually. For example, a trader might spot a share on the JSE rising steadily over two weeks, betting that momentum will carry it further before retreating. This approach suits those who can’t stare at screens all day but still want to take advantage of market shifts.
Indicators help swing traders identify potential entry and exit points by interpreting price data, volume, and volatility. Without them, decisions rely on guesswork or emotional bias, which often leads to losses. Indicators act like a trader’s compass, signalling when a trend is gaining strength, losing steam, or about to reverse. This guidance proves especially useful in the South African market where news, political developments, or loadshedding can cause sudden price moves. Using indicators can make your trades more disciplined and reduce costly mistakes.
Trend indicators track the general direction of price movement, helping traders stay on the right side of a trend. Simple Moving Averages (SMAs) or Exponential Moving Averages (EMAs) smooth out price data, showing whether a share is generally moving up or down. For instance, when the 50-day EMA crosses above the 200-day EMA, it can signal a bullish trend on stocks like Sasol or Naspers. These tools help avoid jumping in too early or holding a position too long during market reversals.
Momentum indicators measure the speed or strength of a price movement. The Relative Strength Index (RSI) is a common example, highlighting if a stock is overbought or oversold. If the RSI dips below 30, it may suggest a buying opportunity as the price has dropped too far; above 70, it hints the asset might be overvalued. Momentum indicators help traders catch the energy behind a move, useful in volatile sectors like mining or retail.
Volatility indicators assess how much price fluctuates over a period. Average True Range (ATR) is key here, showing expected price movement range. Understanding volatility helps set stop-loss levels that aren’t too tight—avoiding being stopped out by normal market noise—or too wide, risking big losses. Local factors like loadshedding or exchange rate swings can increase volatility on JSE shares, so monitoring this helps manage risks better.
Volume indicators track the number of shares traded, confirming the strength of price moves. For example, On-Balance Volume (OBV) rises when price gains come on heavy volume, signalling strong interest. Low volume during price jumps might warn of weak momentum. Volume indicators reassure traders that moves are backed by genuine buying or selling pressure, not just random fluctuations, which is vital when assessing liquidity in less frequently traded shares.
Swing trading relies on blending these indicator types to form a clearer picture of price action, helping traders make smarter, more confident market moves.
Recognising trend directions and potential turning points is vital for swing traders aiming to enter or exit positions smartly. Key indicators help reveal these shifts in the market before prices move dramatically. Understanding how to read these signals aids in making more informed decisions and adjusting strategies accordingly.
Simple moving average (SMA) calculates the average price over a set period, smoothing out daily price fluctuations. For example, a 20-day SMA adds the closing prices of the previous 20 days and divides by 20. This approach shows the general price direction.
In practice, traders watch the SMA to spot trends: prices consistently above the SMA suggest an uptrend, while prices below point to a downtrend. However, SMAs lag behind fast price moves, so relying solely on them may delay trade signals.
Exponential moving average (EMA) puts more weight on recent prices, reacting faster to short-term price changes than the SMA. This makes the EMA more sensitive and useful for swing traders who want quicker trend identification.
For instance, a 12-day EMA adjusts faster to price shifts than a 20-day SMA, helping traders catch trend changes earlier. Yet, increased sensitivity can also mean more false signals during sideways markets.
Using moving average crossovers combines different moving averages to generate trade signals. When a shorter-term moving average crosses above a longer-term one, it often signals a bullish trend, while a cross below indicates bearish momentum.
A common example is the 50-day and 200-day SMA crossover. In South African markets, this method can signal when to enter or exit JSE stocks, especially during periods of volatility influenced by local factors like loadshedding or political events.
Overbought and oversold conditions indicated by RSI help traders identify when an asset may reverse. RSI values over 70 typically suggest an overbought state, signalling the asset might be due for a pullback. Values below 30 show oversold conditions, where prices may bounce back.
For example, a South African retail stock hitting RSI 75 after a run-up may warn of a short-term correction. Swing traders use this to time exits or prepare for reversals closely.
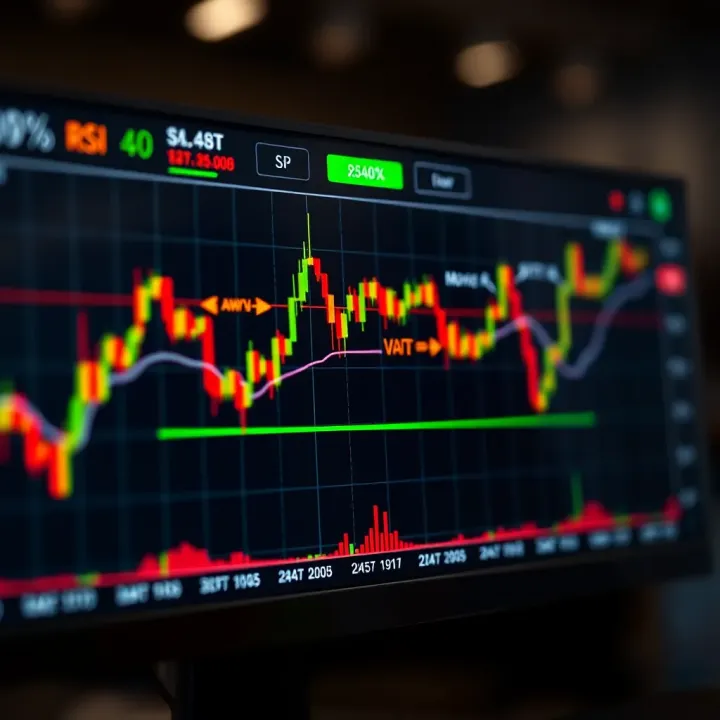
Spotting divergence for reversals occurs when price moves and RSI trend in opposite directions. Bullish divergence happens when prices make lower lows but RSI forms higher lows, hinting at weakening downward momentum and a possible reversal.
Conversely, bearish divergence arises when prices hit higher highs but RSI forms lower highs, suggesting buying strength is fading. Traders can spot these clues to anticipate turning points in assets such as JSE top 40 shares.
Band squeezes and expansions reflect tightening or rising volatility. Squeezes occur when the bands narrow, indicating low volatility and often precede big price moves. Expansions happen when price swings increase, pushing bands further apart.
In South Africa's choppy markets, spotting a squeeze on a commodity stock chart may alert traders to prepare for a breakout or breakdown.
Price action near bands offers practical signals: touching the upper band could indicate overextension, while hitting the lower band might suggest oversold levels.
Traders monitor how price interacts with the bands to gauge whether momentum will continue or reverse, helping sharpen entry or exit timing in fluctuating scenarios like those affected by international trade news impacting South African exporters.
Using these indicators together can paint a clearer picture of where the market is heading and when momentum changes, helping swing traders make smarter, well-timed moves.
Tools designed to support entry and exit points are vital in swing trading. They don't just highlight trends; they help traders decide exactly when to jump in or pull out of a trade. This can make the difference between a tidy profit and leaving money on the table. For example, recognising a precise entry based on an indicator signals can avoid the frustration of chasing a price that has already moved too far.
These tools often focus on timing and risk management. While trend indicators can show overall market direction, entry and exit tools zoom in on moments when momentum shifts or volatility spikes. This means traders have signals guiding them on optimal moments to buy or sell, rather than guessing amid the noise.
The stochastic oscillator measures where the latest closing price sits relative to the recent trading range, usually over 14 periods. Imagine a JSE stock that has traded between R50 and R60 over two weeks. If the price closes near R60, the oscillator approaches 100, indicating strong buying pressure. Conversely, a close near R50 pushes the reading closer to zero, flagging potential weakness.
This relationship helps traders see whether the stock is nearing overbought or oversold conditions. It's a quick way to assess if a price move has the fuel to continue or might stall soon.
Swing traders often look for the stochastic lines—usually %K and %D—to cross as a signal. When %K crosses above %D in oversold territory (below 20), it's a possible buy signal. South African traders using the Capitec share price or Top 40 stocks might monitor this crossover to catch early rebounds after dips.
On the flip side, a cross below %D in overbought zones (above 80) could suggest a sell or short opportunity. The stochastic oscillator’s sensitivity makes it handy for spotting these turning points early, but it is best used with confirmation from other tools.
ATR tracks the degree of price movement and reflects how much a stock or asset fluctuates. For instance, the ATR for a Blue Chip stock listed on the JSE might be R1.50 daily, comparing to R5.00 daily for a more volatile small-cap share. This gives traders a tangible sense of how choppy or calm the market is.
Understanding volatility through ATR helps swing traders avoid setting their stops too tight during noisy sessions or too loose when the market is steady.
Traders commonly use ATR to place stop-loss orders at a certain multiple of the ATR below the entry price. For instance, if a stock's ATR is R2, a stop-loss might be set 1.5 times ATR (R3) below the purchase price. This method adapts the stop to the market’s natural volatility, reducing premature stop-outs from minor fluctuations.
This approach is crucial in South African markets where price swings can be sudden, especially during presidential addresses or global economic shocks impacting the rand.
OBV adds or subtracts daily volume based on whether the closing price rose or fell. Rising OBV alongside rising prices suggests strong buying interest, confirming the price move’s strength. For example, if Sasol shares climb on increasing OBV, it signals genuine demand rather than a brief spike.
Traders can monitor OBV to avoid false breakouts, ensuring volume backs up price trends before committing to trades.
VPT combines price change and volume to weigh volume according to price movements. Unlike simple volume, VPT shows whether volume supports upward or downward price trends. In volatile sectors like mining or retail, tracking VPT helps sharpen timing by revealing hidden strength or weakness.
If a stock moves up but VPT fails to rise, it could warn of weakening momentum, signalling caution in entering long trades.
Tools like stochastic oscillators, ATR, and volume indicators aren’t stand-alone solutions but essential pieces of the swing trading puzzle. They fit together to give you a clearer picture of when to act and how to protect your capital.
Swing trading is like piecing together a puzzle; relying on a single indicator often leaves gaps in your understanding of the market’s behaviour. Combining different indicators gives you a clearer, more reliable picture, confirming signals and helping avoid costly mistakes. When you blend trend, momentum, volume, and volatility tools thoughtfully, you reduce noise and enhance your timing for entries and exits.
Using too many indicators at once can be overwhelming and counterproductive. The key is balancing insight with simplicity. Instead of stacking every available tool, choose a few complementary indicators that serve specific purposes. For example, pairing a moving average (to spot trend direction) with the RSI (to gauge momentum) covers crucial aspects without clutter.
Overloading your chart with dozens of indicators can dilute your focus and produce conflicting signals, making it harder to spot genuine opportunities.
Moreover, too many signals can slow decision-making—a real drawback in fast markets like the Johannesburg Stock Exchange (JSE). Stick to indicators you understand well, and prune any that don’t add clear value to your strategy.
Trend indicators like the Exponential Moving Average (EMA) outline the market’s general direction, while momentum indicators such as the Relative Strength Index (RSI) show whether that trend has strength or is losing steam. Combining the two helps you confirm whether to join a move or wait it out.
For instance, suppose the 20-day EMA is sloping upwards, signalling an uptrend, but the RSI has entered overbought territory above 70. This combination warns you the rally may be stretched, suggesting caution before buying. Conversely, if the EMA indicates a downward trend and RSI drops near oversold levels, traders might expect a reversal soon.
This method reduces the risk of chasing trends prematurely or holding onto a trade too long.
Volume and volatility indicators add another layer of confirmation that makes your trades smarter. Volume measures, like On-Balance Volume (OBV), reveal if there’s strong participation behind price moves—without volume, a breakout might be a false alarm. Similarly, volatility tools like Bollinger Bands or Average True Range (ATR) help you understand price swings and adjust stop-loss levels accordingly.
For example, a price pushing above a resistance level with rising volume suggests the breakout could sustain, while low volume warns it might fail. Likewise, if ATR indicates increasing volatility, you might widen your stop-loss to avoid getting stopped out by normal price swings.
These confirmations help tailor your trading strategy to market dynamics, which is especially useful in South Africa’s volatile sectors like mining or retail stocks.
Combining indicators is not about having a complex arsenal; it’s picking the right tools that talk to each other clearly. Thoughtful pairing and proper interpretation minimise false signals and maximise your chances of smarter market moves.
South African markets come with their own quirks and patterns, so applying swing trading indicators here requires some local know-how. The key lies in understanding how factors like trading hours, volatility drivers, and asset types shape price moves. When you tailor indicator use to these realities, your signals become more reliable and your market moves smarter.
The Johannesburg Stock Exchange (JSE) operates from 9 am to 5 pm SAST, Monday to Friday, but market activity isn’t uniform throughout the day. Typically, the first hour sees high volumes and price swings as traders react to overnight news and global markets opening. This surge can cause indicators like moving averages or volatility tools to show sharper signals than later in the day.
Midday tends to be quieter, with less momentum. Knowing this helps you avoid chasing trades based on weak signals. For example, relying on a Relative Strength Index (RSI) reading near 70 or 30 might be less telling during low liquidity hours. As the market picks up again near closing, volatility can spike, making Average True Range (ATR) especially useful to adjust stop-loss levels.
By syncing indicator analysis with the JSE’s rhythm, you avoid false entries and exits driven by temporary market lulls or bursts. Plus, keep an eye on global market time zones, especially during events like US Fed announcements or China’s trade updates, which can rattle the JSE.
Eskom’s loadshedding, political developments, currency fluctuations, and commodity prices often stir volatility on the JSE. These local drivers can make price movements sudden and sharp, impacting indicator effectiveness if you’re not careful.
For instance, Bollinger Bands might widen quickly on news-triggered moves, signalling increased volatility but not necessarily a trend change. It’s useful to combine volatility measures like ATR with volume indicators to confirm whether a price move is backed by market participation or just a knee-jerk reaction.
Also, in such scenarios, setting wider stop-losses based on ATR readings can help you stay in trades longer without getting stopped out prematurely. This is especially important with JSE resources stocks, which tend to be volatile and react strongly to commodity cycles.
South Africa’s market features a diverse asset mix — from large caps like Naspers and Sasol to ETFs, bonds, and currencies like the rand. Each asset class may behave differently, so your choice and calibration of indicators should reflect that.
For example, trend indicators such as the 50-day EMA can work well for blue-chip stocks with steady liquidity but might lag too much for volatile small caps or single-stock ETFs. In contrast, momentum indicators like the Stochastic Oscillator can provide timely signals in more active shares but require careful filtering.
When trading the rand or commodity ETFs, consider combining volume-based indicators with momentum tools to validate moves, because these assets can spike on geopolitical or economic news.
Using indicators without tuning them to local market traits is like trying to braai with the wrong fire — the results won’t be great. Adaptation is key for smarter, more confident swings.
In short, successful swing trading in South Africa means knowing your market, respecting its rhythms, and adjusting your indicators accordingly. This local edge can make all the difference when timing your trades and managing risk.
📈 Discover the best forex trading indicators! Learn how to use top tools, identify strengths, weaknesses, and combine them for smarter trades in South Africa.

📊 Compare day trading and swing trading strategies, risks, and fits for South African investors. Find the right trading style to match your goals and resources today.

Looking for good swing trading stocks in South Africa? 📈 This practical guide covers key traits, analysis tips, risk management, and how to trade smarter.

📊 Learn how binary trading signals guide buying or selling binary options, explore trusted sources and risks, plus tips tailored for South African traders to trade smartly.
Based on 13 reviews