
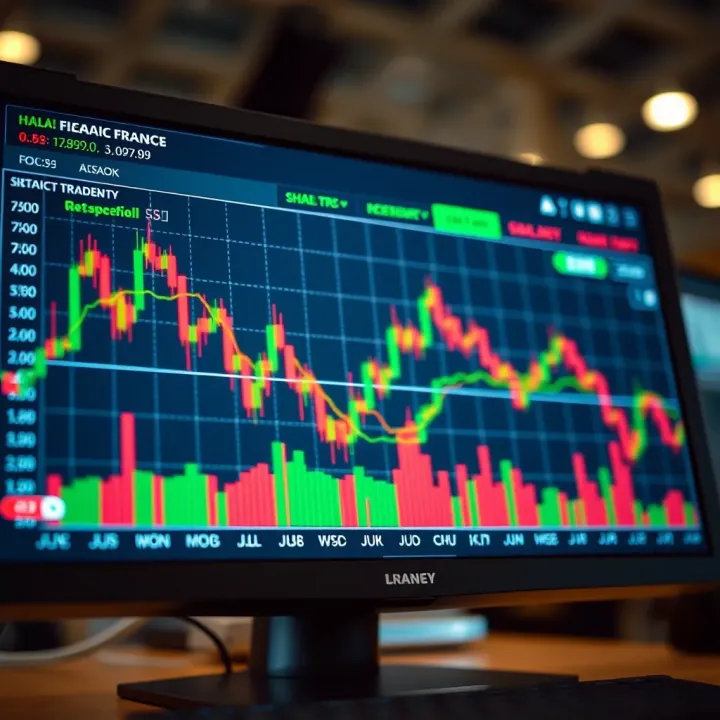
Understanding Halal Forex Trading Basics
Learn about halal forex trading 📈, key Shariah compliance principles, practical strategies, and how Muslim traders in South Africa navigate ethical forex markets.
Edited By
James Fletcher
In forex trading, choosing the right indicator can mean the difference between hitting a winning streak and chasing losses. Traders often rely on technical indicators to make sense of price movements, but no single indicator works for every trader or market condition. Understanding how each tool functions, when to use it, and how to blend indicators can sharpen your approach.
Indicators fall into categories like trend-following, momentum, volatility, and volume-based. For example, moving averages track trends by smoothing out price data, making them useful in persistent market moves. On the other hand, oscillators such as the Relative Strength Index (RSI) detect overbought or oversold conditions, signalling potential reversals.
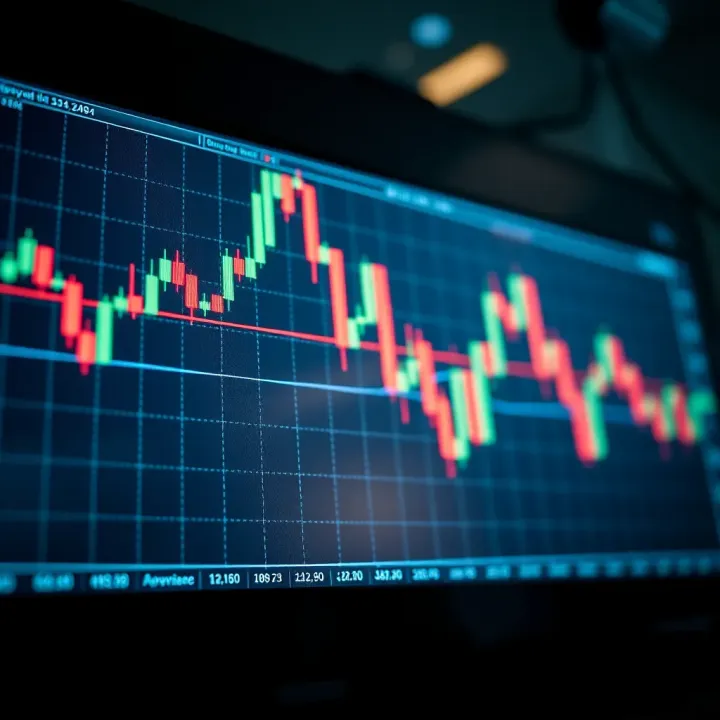
A key point to remember: indicators reflect past price action and should not be used in isolation. Combining complementary indicators often helps confirm signals, reducing false alarms.
Here are some important factors to consider when picking your forex indicators:
Market Conditions: Trend indicators shine in directional markets but struggle during sideways trading; oscillators help in range-bound phases.
Timeframes: Short-term traders may prefer faster indicators like the Stochastic Oscillator, while long-term investors lean on moving averages or Bollinger Bands.
Asset Specifics: Certain currency pairs react differently based on their volatility or liquidity—what works for EUR/USD may not suit ZAR/USD.
For instance, pairing a 50-period Exponential Moving Average (EMA) for trend detection with RSI for momentum can give a clearer picture. When the EMA signals an uptrend and RSI dips near oversold levels, it might be the right time to enter.
In South Africa, with market hours often affected by global news and local economic developments, timely and reliable indicators can help traders stay ahead even during choppy phases.
Next, we’ll explore the most widely used forex indicators, discussing their pros and cons to help you make smarter trading decisions tailored to your strategy.
Forex trading indicators are tools that draw on past price data to help traders make informed decisions. At their core, they act as guides, offering clues about where the market might be heading next. For those stepping onto the forex trading floor, understanding how these indicators operate boosts confidence and allows for smarter trade entries and exits.
Helping identify trends and momentum
Indicators assist traders by clarifying current market direction and the strength behind price moves. For example, a Moving Average smooths out price fluctuations to highlight whether a currency pair is generally moving up or down. Knowing the trend’s direction helps you avoid trading against the market’s flow, which reduces unnecessary risks. Meanwhile, momentum indicators like the Relative Strength Index (RSI) signal how fast or slow prices are changing, helping spot when a trend might be running out of steam.
Supporting entry and exit decisions
Traders commonly use indicators to time their buys and sells better. For instance, Bollinger Bands, which envelop price data, can show moments when a currency’s price is unusually high or low, hinting at potential reversals or breakouts. Entering a trade when an indicator confirms favourable conditions can improve the chance of success. Similarly, indicators can suggest when to lock in profits or cut losses by signalling weakening trends or approaching support and resistance levels.
Reducing emotional bias in trading
One challenge in trading is overcoming emotional reactions like fear or greed, which often lead to poor decisions. Indicators provide objective data to counterbalance these feelings. Instead of guessing, you rely on measurable signals. This roadmap can stop you from chasing every whim of the market mood or reacting prematurely during volatile periods common in forex trading.
Trend-following indicators
These are designed to help traders spot and stay with the prevailing market direction. Moving Averages are a prime example, averaging past prices to reveal a clearer price path. When the price crosses a Moving Average, it may indicate a shift in trend. These tools work well in markets with sustained moves but can produce false signals when the market is choppy.
Momentum oscillators
Momentum indicators measure the speed of price changes, not just direction. The RSI and Stochastic Oscillator fall into this group. They fluctuate within a range and highlight overbought or oversold conditions. In practical terms, if an oscillator shows an extreme reading, it could warn traders that a price reversal is likely soon.
Volatility-based tools
Volatility indicators provide insight into how much a currency pair’s price moves within a period. Bollinger Bands, for example, widen when volatility increases and narrow when the market is calm. Understanding volatility helps traders adjust position size and prepare for potential price swings.
Volume indicators
Though true volume data is limited in forex due to its decentralised nature, some platforms simulate volume by counting ticks or transactions. Volume indicators show interest in a price move—higher volume suggests conviction among traders. This can confirm whether a trend is supported or if a move might fade quickly.
Using the right combination of these indicator types helps traders build a reliable toolkit to interpret the forex market's signals with greater clarity and less guesswork.
Understanding popular forex indicators is key for traders aiming to make smarter decisions in the currency market. These tools help cut through the noise, highlight trends, and pinpoint when to enter or exit trades. For example, a trader looking at the EUR/ZAR pair might use different indicators to read price action during periods of volatility caused by economic reports or even loadshedding interruptions.
Being familiar with these indicators allows you to select those best suited to your trading style and the specific currency pairs you focus on. A close look at the practical applications and limitations of each indicator helps avoid common pitfalls, such as relying solely on one tool or misreading signals during choppy markets.
The SMA calculates the average price over a set number of periods, smoothing out short-term fluctuations. It’s straightforward to interpret, making it a favourite for beginners and seasoned traders alike. For instance, a 50-day SMA on the USD/ZAR chart provides insight into the medium-term trend, helping you spot whether the market sentiment is bullish or bearish.
Traders often use SMA to identify key support and resistance levels, but it lags behind price changes due to equal weighting of all data points. This lag can mean late entries or exits, especially in fast-moving markets.
Unlike SMA, the EMA gives more weight to recent prices, responding faster to new data. This makes it more useful for short-term trading or volatile currency pairs like GBP/ZAR. For example, a 20-day EMA can signal a quicker trend change, aiding scalpers or day traders looking to seize fast momentum shifts.
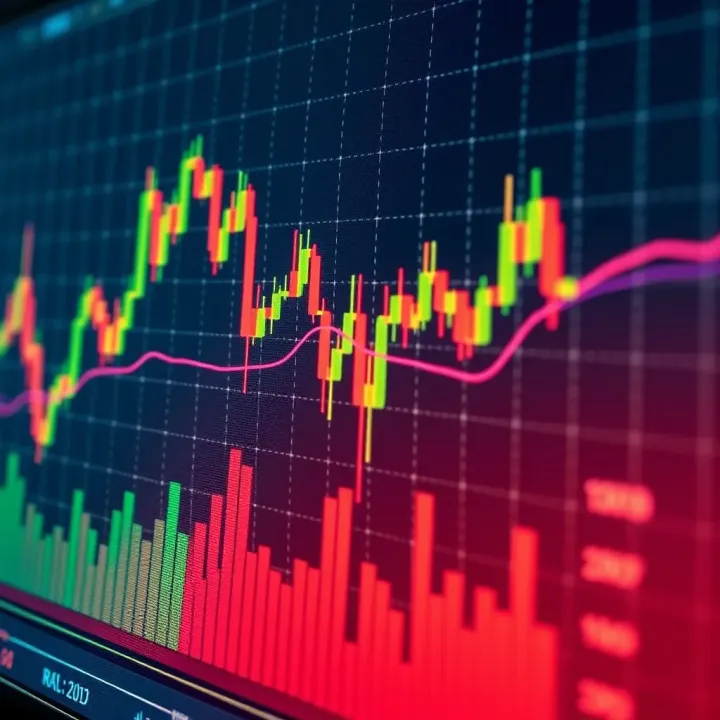
The faster reaction time of EMA helps identify early changes but can also produce whipsaws in sideways markets, so it’s best to combine EMA with other indicators for confirmation.
Moving averages often act as dynamic support or resistance lines. In an uptrend, price tends to bounce off the SMA or EMA, which then serves as a support level. For example, if the price of USD/ZAR pulls back towards the 50-day SMA and holds, that’s a potential entry point for buyers.
Conversely, a moving average could act as resistance in a downtrend. Recognising these levels can guide stop-loss placement or help pinpoint exits before trend reversals.
RSI oscillates between 0 and 100 to indicate when a currency pair might have moved too far, too fast. Typically, readings above 70 suggest overbought conditions, indicating a possible pullback, while readings below 30 imply oversold levels and a potential bounce.
For example, the RSI might warn of an overbought GBP/ZAR ahead of a central bank interest rate announcement, helping traders avoid entering late bullish positions.
Divergence occurs when price movement conflicts with RSI direction. If the pair's price makes a new high but RSI doesn’t, it could signal weakening momentum and an impending reversal.
Spotting divergence on pairs like EUR/USD can give early warnings before a change in trend, helping traders prepare for shifts rather than reacting late.
Bollinger Bands consist of a moving average plus two standard deviations above and below, adjusting to market volatility. When bands widen, volatility is high; when they contract, the market is quiet.
Traders watching USD/ZAR can see when the market calms before a potential sharp move, using the squeeze as a setup for breakout trades.
Price closing outside the bands can signal strong momentum. A close above the upper band may indicate a bullish breakout, while a close below the lower band signals bearish strength.
However, false breakouts are common, so it’s wise to combine Bollinger Bands with volume or momentum indicators to confirm the move.
MACD measures the relationship between two EMAs, showing momentum changes and trend direction. When the MACD line crosses above the signal line, it indicates bullish momentum, and vice versa.
For example, a MACD crossover on the JSE-listed forex instruments might guide traders to enter or exit positions aligned with momentum flow.
Crossovers are the core trading signals of MACD. An upward crossover suggests a good buy opportunity, while a downward crossover might warn to sell or avoid buying.
Using MACD alongside price action or support/resistance levels can increase the reliability of these signals, helping avoid trades based on fake momentum shifts.
Combining knowledge of these indicators, their signals, and limitations can build a solid foundation for forex trading success while navigating South Africa’s unique market environment.
Picking the right indicator for your forex trading isn't just about technical features; it hinges on your specific approach and time horizon. The tools you choose can enhance your decision-making, helping you manage the pace and risks that come with your unique style. Whether you’re hopping in and out of the market multiple times a day or holding positions for weeks, matching indicators to your method can sharpen your edge.
Indicators favoured by scalpers and day traders generally focus on quick reactions and precise timing. Scalpers often turn to tools like the Exponential Moving Average (EMA) or Relative Strength Index (RSI) on short timeframes such as 1-minute or 5-minute charts. These indicators respond quickly to price changes, helping traders catch tiny moves in volatile pairs like USD/ZAR or EUR/USD. A scalper might combine EMA with the Stochastic Oscillator to confirm entry and exit points in fast market conditions.
Day traders, slightly less frantic but still active during market hours, often use Bollinger Bands alongside momentum indicators like the Moving Average Convergence Divergence (MACD). These help identify periods of increased volatility and momentum shifts, offering clues when to enter or exit trades within a day. For example, spotting a squeeze in Bollinger Bands can signal a potential breakout, prompting day traders to act swiftly.
Indicators preferred by swing and position traders cater to slower, more measured moves. These traders often rely on longer-term indicators like the Simple Moving Average (SMA) set to 50 or 200 periods to spot ongoing trends. A swing trader might watch for the price crossing the SMA to time entries or exits over days or weeks, reducing noise compared to shorter timeframes.
Further, tools such as the Average True Range (ATR) assist longer-term traders in assessing volatility to set realistic stop-loss and take-profit levels. For instance, a position trader in the GBP/ZAR pair will use ATR to avoid getting stopped out by normal price fluctuations, keeping trades alive during choppy periods.
Using indicators to set stop-loss and take-profit points is a smart way to blend technical analysis with risk control. Indicators like Bollinger Bands naturally suggest potential support and resistance zones, which can anchor these levels. For example, placing a stop-loss just outside the lower band while targeting a move to the upper band gives a balanced risk/reward setup.
Stop-losses based on ATR readings also adapt to market volatility — wider stops in turbulent conditions and tighter ones in calm markets. This ensures your risk remains proportional to the market's behaviour.
Combining indicators with other risk controls delivers a safety net beyond what any single tool can offer. For instance, a trader might use moving averages to time the trend, RSI to confirm momentum, and sound money management rules like limiting each trade risk to 1-2% of their account. This mix helps avoid overexposure and emotional decision-making.
In South Africa, where currency volatility can be elevated due to economic events or local factors like load shedding, weaving together indicators and strict risk management shields traders from unexpected swings. This layered approach makes your strategy more resilient and reliable.
The best indicator is the one that suits how you trade, helps manage your risk, and fits your personality — not necessarily the one that's most popular.
Traders often find that relying on just one forex indicator can be risky or limited. Combining indicators provides a clearer view of the market by filling gaps and confirming signals. This approach enhances accuracy, improving entry and exit points, and reducing false alarms. It’s especially useful in volatile markets like forex, where signals can change quickly and unpredictably.
Pairing trend and momentum tools is one smart way to combine indicators. Trend indicators, such as moving averages, show the overall direction of the market — whether it’s moving up, down, or sideways. Momentum indicators, such as the Relative Strength Index (RSI), measure the speed or strength of price movement. When used together, they help traders avoid getting caught on lagging signals or false breakouts. For example, a rising moving average aligned with an RSI above 50 suggests a sturdy uptrend with buying momentum, making it a stronger signal to act on.
Recognising when indicators confirm each other is key to filtering out noise. If two or more indicators point toward the same outcome, the chance of a successful trade improves. For instance, if the Moving Average Convergence Divergence (MACD) shows a bullish crossover and Bollinger Bands indicate price breaking above the upper band, this double confirmation suggests a robust upward move ahead. Confirmation helps reduce emotional trades based on gut feeling, letting traders stick to a plan backed by data.
Using RSI with Moving Averages blends trend direction with momentum insights. Moving averages smooth out price data to reveal the market’s general path, while RSI highlights if prices are too stretched (overbought or oversold). For example, if the price is above a 20-day exponential moving average (EMA) and the RSI falls below 30, it could indicate a temporary dip in a strong uptrend — a possible buying opportunity. This combo helps traders avoid entering trades during weak or uncertain moves.
MACD and Bollinger Bands in tandem adds complementary perspectives on momentum and volatility. Bollinger Bands expand and contract depending on market volatility, flagging potential breakouts or retracements. Meanwhile, MACD tracks momentum shifts through moving average crossovers. When MACD gives a bullish signal near the lower Bollinger Band, it may signal a rebound starting from an undervalued position. Traders can use this combo to time entries around price bounces rather than chasing trends blindly.
Combining indicators is not about piling on every tool available but about choosing those that complement each other and provide clearer trading signals. This strategy helps South African traders navigate the forex market’s ups and downs with greater confidence.
By understanding how indicators interact and support each other, you can sharpen your trading edge and manage risk better in South Africa’s dynamic forex environment.
Using indicators effectively isn’t just about knowing which ones to pick. You need to integrate them carefully into your daily trading decisions. This means understanding when to rely on them, how to combine their signals with price action, and, importantly, tailoring their use to your preferred currency pairs and trading style. If you jump in without testing or fail to marry indicators with what the markets are actually doing, you risk making costly mistakes.
Backtesting is like a rehearsal — it lets you try out your chosen indicator settings against past market data before risking real money. By applying indicators to historical price moves, you can get a sense of how well they might predict future trends or reversals on specific currency pairs. This helps to weed out strategies that don’t work well for certain pairs or market conditions.
When using backtesting, it’s important to work with clean and reliable historical data. For example, if you trade the USD/ZAR pair, look for data covering various market phases, such as periods of volatility around South African elections or global commodity price shocks. This gives your backtest real depth, reflecting how your indicators perform through different scenarios.
In South Africa, platforms like MetaTrader 4 and 5 remain popular for backtesting forex strategies, as they offer robust historical data and allow custom indicator settings. Local brokers sometimes provide demo environments with data tailored to the rand’s market. Tools like TradingView, which offers both free and paid plans, have gained traction for their user-friendly charting and sharing capabilities, making it easier for traders to review and discuss their backtests in forums and communities.
Over-relying on indicators without considering price action often leads to confusion. Indicators are derivative tools; they reflect price movements but don’t replace the naked chart’s story. For instance, you might get a buy signal from the RSI but ignore a strong resistance zone visible on the price chart. This disconnect means you act on a lagging signal and miss contextual cues, which can wipe out profits.
It’s crucial to balance indicator signals with simple chart reading — support and resistance levels, candlestick patterns, and volume spikes. In South African markets, where news events can trigger sharp moves, price action often tells you more than an indicator alone.
Ignoring fundamental factors is another pitfall. Indicators can't see beyond numbers; they don’t account for political developments, like changes in Reserve Bank policy or loadshedding disruptions, which heavily influence exchange rates. For example, a technically strong setup for the ZAR might unravel instantly when a surprise SARB rate cut occurs or when Eskom announces stage 4 loadshedding.
Traders should incorporate fundamental awareness alongside technical tools to avoid being blindsided. This means staying updated on economic releases, geopolitical news, and local factors impacting the rand.
Practical trading blends technical signals with the wider market picture. Indicators are guides, not gospel. Keeping an eye on both charts and fundamentals will help you make smarter, more confident decisions.
Learn about halal forex trading 📈, key Shariah compliance principles, practical strategies, and how Muslim traders in South Africa navigate ethical forex markets.

🌍 Learn how different Forex trading sessions affect market moves and volatility. Master session timing to sharpen your trading skills and manage risks better.
🌍 Discover how global forex trading works, exploring market structure, currency factors, strategies, risk control & tech tools for smarter currency trades.
📈 Explore forex trading training in Johannesburg with our detailed guide. Learn types, costs, and how to pick the right course to trade with confidence. 🇿🇦
Based on 11 reviews