

Key Forex Terms Every Trader Should Know
📊 Master essential forex trading terms to confidently navigate currency markets. Learn about concepts, orders, tools, participants & risk management today!
Edited By
Emily Carter
Forex trading demands more than just a glance at price charts; understanding the signals those charts send can be game-changing. Candlestick patterns are among the most reliable tools in a trader’s kit, offering a clear visual summary of market sentiment in a simple, digestible format. These patterns, formed by consecutive price movements within a set timeframe, can point to potential market direction changes or continuations.
In South Africa’s dynamic forex scene, recognising and applying these candlestick patterns effectively can help traders navigate currency volatility and the impacts of global events on the rand. Whether you’re trading USD/ZAR or EUR/ZAR, knowing when a pattern signals a reversal or a strong trend can improve your entries and exits, reducing guesswork.
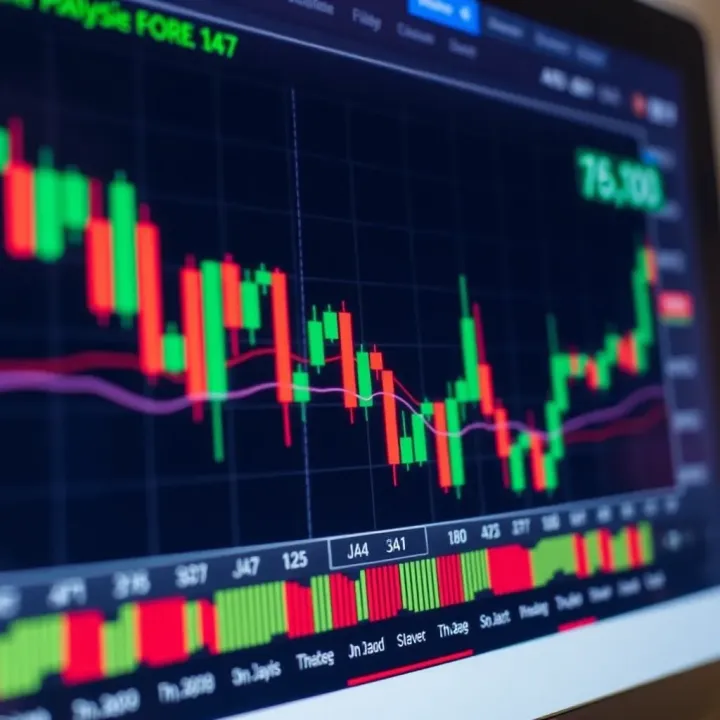
This section introduces essential candlestick patterns and explains how to combine them with solid strategies to enhance your trading results:
Candlestick charts display four key prices: open, high, low, and close, within a specific period. By linking these price points, each candle shows if bulls or bears took charge during that session.
Hammer and Hanging Man: Both feature small bodies with long lower wicks. A hammer often suggests a bullish reversal after a downtrend, while a hanging man signals potential bearishness after an uptrend.
Engulfing Patterns: A bullish engulfing happens when a smaller red candle is followed by a larger green one, indicating buyers overpower sellers. The bearish counterpart suggests the reverse.
Doji: When the open and close prices are nearly identical, this candle hints at market indecision, often preceding a trend shift.
Candlestick signals rarely stand alone. They become powerful when confirmed by other indicators—like moving averages, Relative Strength Index (RSI), or volume trends. For example, spotting a bullish engulfing pattern near a key support level and with rising volume adds confidence to a buy trade.
Effective forex trading combines pattern recognition, broader technical analysis, and a solid risk management framework.
Keep Eskom loadshedding schedules in mind; trade with stable internet connections to avoid mistimed executions.
Use demo accounts on local brokers such as IG Markets South Africa or HotForex SA to practise spotting patterns under live market conditions.
Factor in rand liquidity and volatility, which can differ markedly from majors like the USD or EUR.
Understanding candlestick patterns is the first step towards building actionable trading strategies. Mastery comes with disciplined application and aligning these tools with your trading style and risk appetite.
Grasping the basics of forex candlestick patterns is a must for anyone serious about trading. These patterns help you make sense of price movements in currency pairs, showing shifts in market sentiment quickly and clearly. When you recognise these patterns, you have a better chance of spotting potential entry and exit points, which can improve your trading outcomes.
Candlestick charts give a clear visual snapshot of price action for a specific time frame—whether that’s one minute or one day. Each candlestick reflects how the price moved during that period, showing both the opening and closing prices as well as the highs and lows. This way, traders can instantly see whether buyers or sellers were stronger without scanning through complicated numbers.
The candlestick’s parts—body, wick, and shadows—play a key role in interpreting the price action. The body represents the range between the open and close prices, showing if the market moved up or down. Thin lines above and below the body, called wicks or shadows, mark the highest and lowest prices reached. These tell us how far prices were pushed before settling.
Unlike line charts that connect closing prices or bar charts that separate price stats, candlestick charts combine all this info into a single, easy-to-digest shape. This makes spotting trends, reversals, or indecision quicker and more intuitive.
Candles come in two main flavours: bullish and bearish. A bullish candle tells you the price closed higher than it opened—buyers were in control. Conversely, a bearish candle shows the price dropped below the opening level, so sellers had the upper hand. This simple colour coding, usually green or white for bullish and red or black for bearish candles, provides an instant flavour of market momentum.
Getting familiar with the open, close, high, and low is vital. The open is where the price started during the period, and the close is where it finished. High and low mark the extremes price touched but didn’t necessarily stay at. For example, a long upper wick with a small body might suggest a price spike met heavy resistance.
The size of the candle body and its colour also provide clues. A large bullish candle can signal strong buying pressure, while a small body with long wicks could indicate indecision or possible reversal zones. Say you see a long red candle following a string of green candles—it could flag a shift, requiring a closer look at support or resistance nearby.
Recognising how candlestick size and colour interact with price zones allows you to spot signals that matter, filtering out noise from random fluctuations.
Understanding these basics sets the stage for building trading strategies that use candlestick patterns effectively, especially when combined with other technical tools. That way, you don’t just guess; you trade with clearer insight into what’s moving the market.
Candlestick patterns offer traders a clear window into market sentiment and potential price movements. Recognising these common setups is a practical step toward making better-informed trading decisions. Whether you're spotting a single candle indicating indecision or a sequence hinting at a reversal, understanding these patterns can improve your timing and confidence in entering or exiting trades.
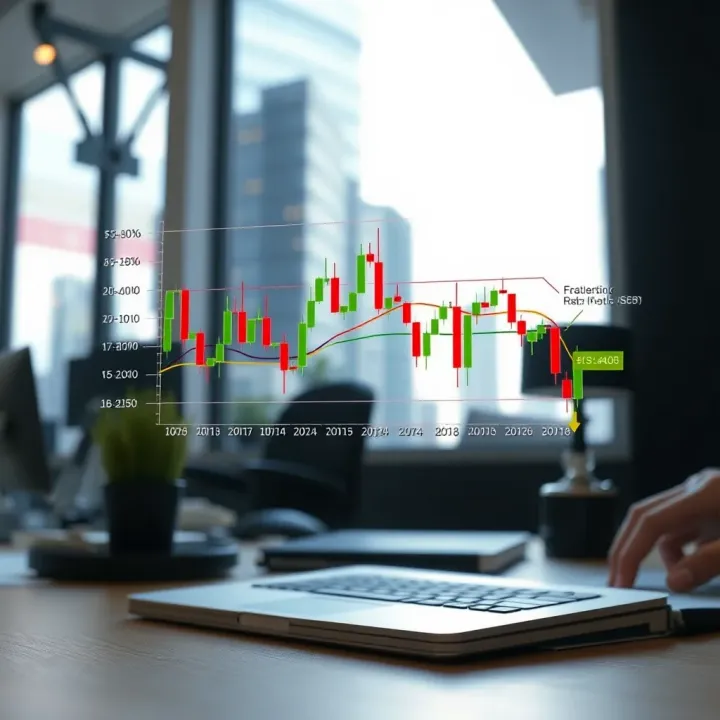
Doji candles form when the opening and closing prices are nearly identical, resulting in a tiny or non-existent body. This shape signals indecision between buyers and sellers. In forex trading, a Doji appearing after a strong trend often warns that the momentum might be weakening, suggesting a possible reversal or pause. There are various types—like the long-legged Doji signalling extreme uncertainty and the dragonfly or gravestone Doji hinting at potential bullish or bearish shifts.
Both the hammer and hanging man show small bodies with long lower wicks but differ in their context. A hammer occurring after a downtrend may indicate that sellers pushed prices down, but buyers eventually regained control, signalling a possible bottom and reversal upwards. By contrast, the hanging man appears after an uptrend. Although it shares the same shape, it warns that selling pressure is appearing near the high and might lead to a downturn.
These two patterns signal potential reversals as well, but they appear in different contexts. A shooting star forms after an uptrend and presents a small body with a long upper wick. It reflects failure to sustain higher prices and suggests sellers might be stepping in. On the other hand, the inverted hammer appears after a downtrend and implies buyers are attempting to push prices up, marking a possible bottom. Both require confirmation from subsequent candles.
Engulfing patterns involve two candles where the second completely covers the first’s body. A bullish engulfing pattern appears at a downtrend’s end with a strong upward candle overtaking a smaller bearish candle, indicating buyers taking charge. Conversely, a bearish engulfing pattern follows an uptrend, with a large bearish candle consuming a prior smaller bullish one, hinting at a shift toward selling pressure. These patterns often lead to notable moves and are favoured for their clarity.
Both are two-candle reversal patterns rooted in gaps and price overlap. The piercing line occurs after a downtrend when a bullish candle opens lower but closes above the midpoint of the previous bearish candle, suggesting a buying turnaround. Dark cloud cover appears after an uptrend; a bearish candle opens higher but closes below the prior bullish candle’s midpoint, warning of weakening bulls. These provide early clues before bigger trend changes.
The morning star is a three-candle bullish reversal pattern: it starts with a strong bearish candle, then a small-bodied candle showing indecision, followed by a powerful bullish candle closing well within the initial bearish candle’s range. This sequence signals a gradual change from selling to buying. The evening star mirrors this pattern at the top of an uptrend and signals a potential downturn. Traders watch these for more reliable signals as they combine momentum shifts and market hesitation.
Mastering these common candlestick patterns helps traders recognise key turning points and better read market sentiment, especially when integrated with other analysis tools.
Building a strategy around forex candlestick patterns adds practical structure to trading decisions. Unlike chasing random signals, a well-developed strategy helps you interpret patterns within the broader market context. It's about knowing when a hammer signal near support is worth acting on, or when a doji at resistance is a warning to hold back.
Support and resistance zones are price levels where the market historically tends to pause or reverse. Identifying these zones on your charts helps you know where buying or selling pressure might emerge. For example, if the rand-dollar USDZAR pair shows a bullish engulfing pattern near a known support zone, this may hint at a strong bounce.
Confirming candlestick signals close to these key levels improves your chance of success. The market respects these boundaries, so a pattern that forms near support or resistance is more meaningful. If a shooting star appears just below resistance in the EURZAR, it suggests sellers could push prices down. Combining pattern signals with these levels gives clearer entry or exit cues.
Moving averages smooth out price data to highlight trend direction. A common approach is to watch the 50-day and 200-day moving averages to gauge medium and longer-term trends. When the price stays above the moving average, the trend is likely up; below means down.
Aligning your trades with the prevailing trend increases odds of winning. For instance, in a strong uptrend on GBPZAR, bullish candlestick patterns like morning stars gain more weight. Avoid fighting the trend by shorting during clear upward momentum.
Volume shows how much of a currency is traded during a given time and can confirm the strength behind a candlestick pattern. A bullish engulfing pattern with volume higher than the average day carries more conviction that buyers are serious.
Indicators like RSI (Relative Strength Index) and MACD (Moving Average Convergence Divergence) offer extra insight. RSI signals overbought or oversold conditions, which can validate candlestick reversal signals. MACD highlights momentum shifts. When a bullish candlestick pattern coincides with RSI moving from oversold and MACD signalling a crossover, it strengthens the case to consider a buy.
Trading candlestick patterns is never about one signal alone. Combine them with support, trend analysis, volume, and indicators to make more informed decisions.
This combined approach is especially helpful for South African traders who face the rand's volatility and local moments affecting market activity. Your strategy becomes a comprehensive method rather than guesswork.
Risk management is the backbone of consistent forex trading success. No matter how accurate your candlestick pattern analysis is, neglecting risk controls can quickly erode your capital. Trade execution, meanwhile, is about turning those setups into efficient trades by managing entries, exits, and position sizes thoughtfully. Together, these elements protect your wallet and help you stay in the game longer.
Placing stop-loss orders based on candle wicks involves using the highest or lowest points of candlestick wicks to set safe boundaries for your trades. For instance, after spotting a bullish engulfing pattern near a support level, you'll often place a stop-loss just below the wick low of that pattern. This approach gives your trade some room to breathe while limiting losses if the market moves against you. The candle’s wick essentially marks a recent extreme point where buyers or sellers briefly pushed the price, making it a logical place to hedge against a deeper reversal.
Determining realistic profit targets is just as vital. Rather than aiming for a fixed number of pips, consider the size of the candlestick patterns and nearby resistance or support levels. For example, if a hammer candle forms at a support level, it’s sensible to target the next significant resistance point rather than an arbitrary price. This way, your reward-to-risk ratio aligns with the market context. Often, setting your take-profit distance at twice the size of your stop-loss distance can offer a balanced approach, though this depends on the currency pair’s volatility.
Calculating trade size according to risk tolerance starts by deciding what percentage of your total capital you’re comfortable losing on a single trade—typically between one and three per cent. If your stop-loss is 40 pips away, and you’re risking no more than R500 on the trade, you adjust your lot size accordingly. Ignoring this step can lead you to overtrade and blow your account faster than you can say "Eskom loadshedding." In South Africa’s sometimes volatile Forex scene, this discipline is especially useful to survive unexpected market shocks.
The importance of diversification in forex trading cannot be overstated. Don’t put all your eggs in one basket by trading only the USD/ZAR pair, even though it’s a popular choice. By spreading your exposure across different currency pairs, you reduce the impact from any single market’s swings or economic announcements. For example, combining trades in EUR/USD, GBP/ZAR, and AUD/USD helps smooth out fluctuations, as these pairs often react differently to global and local events. This approach reduces risk and helps maintain steadier growth in your portfolio.
Consistent risk management and smart trade execution transform guesswork into a disciplined process, helping you protect your capital and stay competitive in the forex market.
Getting these basics right makes a real difference, especially when volatile South African factors like SARB decisions or commodity price shifts come into play.
Trading the rand (ZAR) forex pairs requires a firm grasp of local economic influences and market quirks. Simply applying overseas candlestick strategies without adjustment can lead to costly misreads. South African traders benefit from tailoring their approach to factors like SARB (South African Reserve Bank) policy moves, commodity price shifts, and practical challenges such as loadshedding. These elements shape market volatility, liquidity, and trading hours more than many realise.
The rand is notably sensitive to SARB’s interest rate decisions and monetary policy statements. For example, unexpected SARB rate hikes often cause sharp ZAR appreciation, triggering sudden candlestick patterns signalling reversals or continuation. Traders spotting a bullish engulfing pattern near a SARB announcement might anticipate further strengthening, while bearish patterns could warn of sell-offs if inflation pressures ease.
Commodity prices also weigh heavily. South Africa’s economy leans on gold, platinum, and coal exports; a slump in prices often drags the rand down, creating volatile candles with long wicks as buyers and sellers battle. By integrating these factors, traders can better judge whether a pattern signals a false breakout or a genuine trend shift.
Loadshedding impacts trading volume and session timings, which can distort candlestick data. During stage 4 or higher, many retail traders and small institutions might experience power disruptions, leading to thinner liquidity during certain hours. This can result in erratic candles – for instance, spikes with little follow-through or extended wicks due to sudden order imbalances.
To manage this, traders should monitor Eskom’s loadshedding schedules and avoid relying solely on patterns formed during known blackout periods. Platforms with reliable mobile or offline functionality can help maintain access. Worked into a strategy, recognising these trading ‘blind spots’ helps avoid mistaken entries or exits based on misleading candles.
Many brokers operating in South Africa offer global platforms, but locals often prefer those with a tangible presence or clear adherence to FSCA (Financial Sector Conduct Authority) rules. Brokers with local support handle SARB data feeds more efficiently, manage rand funding and withdrawals smoothly, and understand regional trading behaviour.
For example, a local VPS (Virtual Private Server) can reduce latency issues for rand pairs, making candlestick signals more reliable in fast-moving markets. Always ensure your broker has a valid FSCA licence and offers transparent pricing to avoid surprises.
Data costs can quickly mount up when streaming live forex charts in South Africa, especially on mobile networks like Vodacom or MTN. Candlestick patterns lose meaning if charts lag or disconnect. Traders should explore low-data-charting apps or platforms that allow adjustable tick rates to curb unnecessary data use.
Offline charting tools that update when connected, plus careful scheduling around loadshedding, prevent missed signals. Also, setting alerts for key candlestick patterns saves constant screen time and data. Efficient use of data keeps trading accessible and less frustrating, even with limited bandwidth.
South African traders who adapt candlestick strategies with local economic insight and practical tech tips stand a better chance of turning signals into solid trades. After all, savvy trading isn’t just about patterns—it’s about context, timing, and execution in Mzansi’s unique market landscape.
📊 Master essential forex trading terms to confidently navigate currency markets. Learn about concepts, orders, tools, participants & risk management today!

Explore practical forex trading strategies 📈 for consistent success in South Africa 🇿🇦. Learn risk management, market adaptations, and essential techniques.
Discover key forex trading strategies📈 using fundamental analysis. Learn how economic indicators, interest rates & geopolitics shape currency trades in South Africa.

📈 Discover solid forex trading strategies for beginners in South Africa. Learn key concepts, risk management, and practical tips to trade confidently!
Based on 9 reviews